
Hong Kong SAR, China - Jewelry - Market Analysis, Forecast, Size, Trends and Insights
Get instant access to more than 2 million reports, dashboards, and datasets on the IndexBox Platform.
View PricingOctober 2023 Sees a 10% Decline As Hong Kong's Jewelry Imports Plummet to $1.8B.
Hong Kong Jewelry Imports
In October 2023, jewelry imports into Hong Kong expanded modestly to 29 tons, rising by 3.7% compared with the previous month. In general, imports saw a relatively flat trend pattern. The most prominent rate of growth was recorded in April 2023 when imports increased by 185% against the previous month. As a result, imports reached the peak of 96 tons. From May 2023 to October 2023, the growth of imports failed to regain momentum.
In value terms, jewelry imports contracted to $1.8B (IndexBox estimates) in October 2023. Overall, imports saw a relatively flat trend pattern. The most prominent rate of growth was recorded in February 2023 with an increase of 24% against the previous month.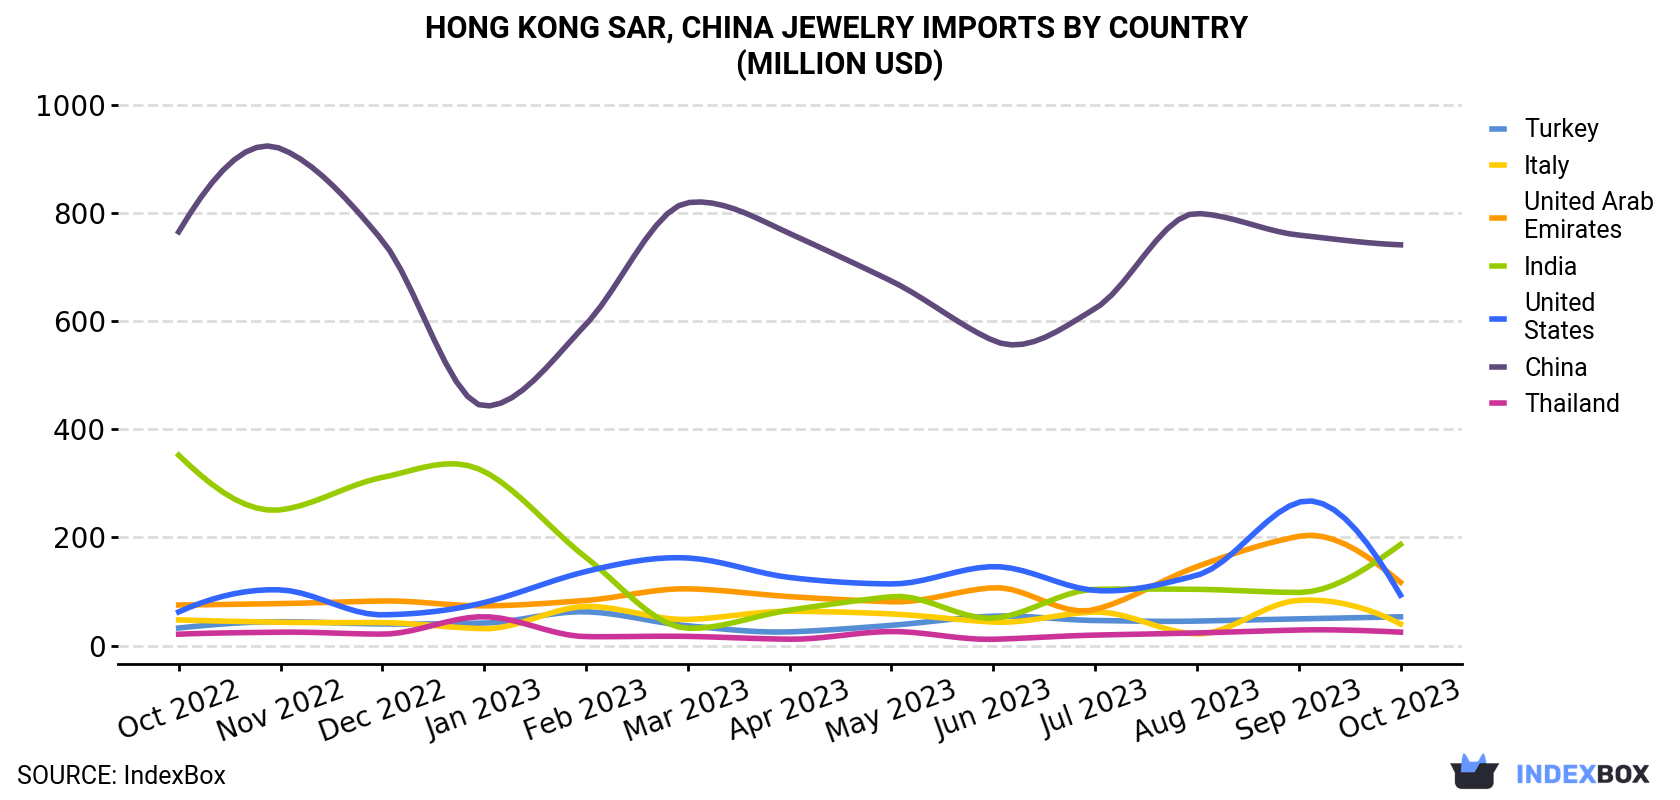
| COUNTRY | Import Value of Jewelry in Hong Kong (million USD) | ||||||||||||
|---|---|---|---|---|---|---|---|---|---|---|---|---|---|
| Oct 2022 | Nov 2022 | Dec 2022 | Jan 2023 | Feb 2023 | Mar 2023 | Apr 2023 | May 2023 | Jun 2023 | Jul 2023 | Aug 2023 | Sep 2023 | Oct 2023 | |
| China | 765 | 919 | 749 | 443 | 594 | 819 | 762 | 674 | 564 | 623 | 799 | 759 | 741 |
| India | 352 | 251 | 311 | 322 | 163 | 32.0 | 65.6 | 90.4 | 50.7 | 104 | 104 | 98.3 | 187 |
| United Arab Emirates | 75.1 | 77.7 | 82.5 | 73.5 | 83.5 | 105 | 90.6 | 81.0 | 107 | 66.7 | 146 | 202 | 117 |
| United States | 62.3 | 103 | 56.9 | 79.5 | 137 | 162 | 126 | 114 | 146 | 102 | 130 | 265 | 93.2 |
| Turkey | 32.5 | 44.2 | 40.0 | 41.7 | 62.5 | 36.6 | 25.4 | 37.5 | 54.4 | 46.4 | 45.3 | 49.4 | 53.2 |
| Italy | 47.5 | 43.2 | 42.4 | 31.2 | 72.4 | 48.3 | 63.5 | 58.5 | 43.5 | 62.1 | 21.5 | 83.8 | 40.0 |
| Thailand | 21.1 | 24.8 | 21.2 | 53.4 | 16.6 | 17.0 | 11.8 | 26.0 | 11.7 | 19.4 | 23.4 | 28.8 | 24.9 |
| Others | 433 | 398 | 368 | 286 | 526 | 721 | 722 | 615 | 523 | 712 | 546 | 556 | 584 |
| Total | 1,789 | 1,860 | 1,672 | 1,330 | 1,656 | 1,942 | 1,866 | 1,696 | 1,500 | 1,735 | 1,815 | 2,042 | 1,840 |
Imports by Country
In October 2023, China (15 tons) constituted the largest supplier of jewelry to Hong Kong, with a 53% share of total imports. Moreover, jewelry imports from China exceeded the figures recorded by the second-largest supplier, Italy (5.6 tons), threefold. The United Arab Emirates (1.9 tons) ranked third in terms of total imports with a 6.7% share.
From October 2022 to October 2023, the average monthly rate of growth in terms of volume from China was relatively modest. The remaining supplying countries recorded the following average monthly rates of imports growth: Italy (+4.9% per month) and the United Arab Emirates (+2.6% per month).
In value terms, China ($741M) constituted the largest supplier of jewelry to Hong Kong, comprising 40% of total imports. The second position in the ranking was held by India ($187M), with a 10% share of total imports. It was followed by the United Arab Emirates, with a 6.4% share.
From October 2022 to October 2023, the average monthly rate of growth in terms of value from China was relatively modest. The remaining supplying countries recorded the following average monthly rates of imports growth: India (-5.1% per month) and the United Arab Emirates (+3.8% per month).
Imports by Type
Non-silver precious metal jewelry (16 tons), silver jewelry (12 tons) and base metal jewelry clad with precious metals (862 kg) were the main products of jewelry imports to Hong Kong, together comprising 99% of total imports. These products were followed by non-silver precious metal non-jewelry articles and silver goldsmiths non-jewelry articles, which together accounted for a further 1.2%.
From October 2022 to October 2023, the biggest increases were in precious metal-clad jewelry of base metals (with a CAGR of +9.8%), while purchases for the other products experienced mixed trend patterns.
In value terms, non-silver precious metal jewelry ($1.6B) constituted the largest type of jewelry supplied to Hong Kong, comprising 89% of total imports. The second position in the ranking was taken by silver jewelry ($190M), with a 10% share of total imports. It was followed by non-silver precious metal non-jewelry articles, with a 0.9% share.
Import Prices by Country
In October 2023, the jewelry price stood at $63.1M per ton (CIF, Hong Kong), dropping by -13.1% against the previous month. Over the period under review, the import price saw a relatively flat trend pattern. The most prominent rate of growth was recorded in August 2023 an increase of 123% against the previous month. The import price peaked at $72.6M per ton in September 2023, and then shrank in the following month.
Prices varied noticeably by the country of origin: the country with the highest price was India ($345M per ton), while the price for Italy ($7.2M per ton) was amongst the lowest.
From October 2022 to October 2023, the most notable rate of growth in terms of prices was attained by Japan (+2.9%), while the prices for the other major suppliers experienced more modest paces of growth.
This report provides an in-depth analysis of the jewelry market in Hong Kong SAR, China. Within it, you will discover the latest data on market trends and opportunities by country, consumption, production and price developments, as well as the global trade (imports and exports). The forecast exhibits the market prospects through 2030.
Product coverage:
- Prodcom 32121330 - Articles of jewellery and parts thereof of precious metal (including plated, clad)
- Prodcom 32121351 - Articles of goldsmiths
- Prodcom 32121353 - Articles of goldsmiths
- Prodcom 32121355 - Articles of goldsmiths
Country coverage:
- Hong Kong SAR
Data coverage:
- Market volume and value
- Per Capita consumption
- Forecast of the market dynamics in the medium term
- Trade (exports and imports) in Hong Kong SAR, China
- Export and import prices
- Market trends, drivers and restraints
- Key market players and their profiles
Reasons to buy this report:
- Take advantage of the latest data
- Find deeper insights into current market developments
- Discover vital success factors affecting the market
This report is designed for manufacturers, distributors, importers, and wholesalers, as well as for investors, consultants and advisors.
In this report, you can find information that helps you to make informed decisions on the following issues:
- How to diversify your business and benefit from new market opportunities
- How to load your idle production capacity
- How to boost your sales on overseas markets
- How to increase your profit margins
- How to make your supply chain more sustainable
- How to reduce your production and supply chain costs
- How to outsource production to other countries
- How to prepare your business for global expansion
While doing this research, we combine the accumulated expertise of our analysts and the capabilities of artificial intelligence. The AI-based platform, developed by our data scientists, constitutes the key working tool for business analysts, empowering them to discover deep insights and ideas from the marketing data.
-
1. INTRODUCTION
Making Data-Driven Decisions to Grow Your Business
- REPORT DESCRIPTION
- RESEARCH METHODOLOGY AND AI PLATFORM
- DATA-DRIVEN DECISIONS FOR YOUR BUSINESS
- GLOSSARY AND SPECIFIC TERMS
-
2. EXECUTIVE SUMMARY
A Quick Overview of Market Performance
- KEY FINDINGS
- MARKET TRENDS This Chapter is Available Only for the Professional Edition PRO
-
3. MARKET OVERVIEW
Understanding the Current State of The Market and Its Prospects
- MARKET SIZE
- MARKET STRUCTURE
- TRADE BALANCE
- PER CAPITA CONSUMPTION
- MARKET FORECAST TO 2030
-
4. MOST PROMISING PRODUCT
Finding New Products to Diversify Your Business
This Chapter is Available Only for the Professional Edition PRO- TOP PRODUCTS TO DIVERSIFY YOUR BUSINESS
- BEST-SELLING PRODUCTS
- MOST CONSUMED PRODUCT
- MOST TRADED PRODUCT
- MOST PROFITABLE PRODUCT FOR EXPORT
-
5. MOST PROMISING SUPPLYING COUNTRIES
Choosing the Best Countries to Establish Your Sustainable Supply Chain
This Chapter is Available Only for the Professional Edition PRO- TOP COUNTRIES TO SOURCE YOUR PRODUCT
- TOP PRODUCING COUNTRIES
- TOP EXPORTING COUNTRIES
- LOW-COST EXPORTING COUNTRIES
-
6. MOST PROMISING OVERSEAS MARKETS
Choosing the Best Countries to Boost Your Exports
This Chapter is Available Only for the Professional Edition PRO- TOP OVERSEAS MARKETS FOR EXPORTING YOUR PRODUCT
- TOP CONSUMING MARKETS
- UNSATURATED MARKETS
- TOP IMPORTING MARKETS
- MOST PROFITABLE MARKETS
7. PRODUCTION
The Latest Trends and Insights into The Industry
- PRODUCTION VOLUME AND VALUE
8. IMPORTS
The Largest Import Supplying Countries
- IMPORTS FROM 2012–2023
- IMPORTS BY COUNTRY
- IMPORT PRICES BY COUNTRY
9. EXPORTS
The Largest Destinations for Exports
- EXPORTS FROM 2012–2023
- EXPORTS BY COUNTRY
- EXPORT PRICES BY COUNTRY
-
10. PROFILES OF MAJOR PRODUCERS
The Largest Producers on The Market and Their Profiles
This Chapter is Available Only for the Professional Edition PRO -
LIST OF TABLES
- Key Findings In 2023
- Market Volume, In Physical Terms, 2012–2023
- Market Value, 2012–2023
- Per Capita Consumption In 2012-2023
- Imports, In Physical Terms, By Country, 2012–2023
- Imports, In Value Terms, By Country, 2012–2023
- Import Prices, By Country Of Origin, 2012–2023
- Exports, In Physical Terms, By Country, 2012–2023
- Exports, In Value Terms, By Country, 2012–2023
- Export Prices, By Country Of Destination, 2012–2023
-
LIST OF FIGURES
- Market Volume, In Physical Terms, 2012–2023
- Market Value, 2012–2023
- Market Structure – Domestic Supply vs. Imports, In Physical Terms, 2012-2023
- Market Structure – Domestic Supply vs. Imports, In Value Terms, 2012-2023
- Trade Balance, In Physical Terms, 2012-2023
- Trade Balance, In Value Terms, 2012-2023
- Per Capita Consumption, 2012-2023
- Market Volume Forecast to 2030
- Market Value Forecast to 2030
- Products: Market Size And Growth, By Type
- Products: Average Per Capita Consumption, By Type
- Products: Exports And Growth, By Type
- Products: Export Prices And Growth, By Type
- Production Volume And Growth
- Exports And Growth
- Export Prices And Growth
- Market Size And Growth
- Per Capita Consumption
- Imports And Growth
- Import Prices
- Production, In Physical Terms, 2012–2023
- Production, In Value Terms, 2012–2023
- Imports, In Physical Terms, 2012–2023
- Imports, In Value Terms, 2012–2023
- Imports, In Physical Terms, By Country, 2023
- Imports, In Physical Terms, By Country, 2012–2023
- Imports, In Value Terms, By Country, 2012–2023
- Import Prices, By Country Of Origin, 2012–2023
- Exports, In Physical Terms, 2012–2023
- Exports, In Value Terms, 2012–2023
- Exports, In Physical Terms, By Country, 2023
- Exports, In Physical Terms, By Country, 2012–2023
- Exports, In Value Terms, By Country, 2012–2023
- Export Prices, By Country Of Destination, 2012–2023


