
Italy - Jerseys, Pullovers, Cardigans And Similar Articles - Market Analysis, Forecast, Size, Trends and Insights
Get instant access to more than 2 million reports, dashboards, and datasets on the IndexBox Platform.
View PricingItaly's August 2023 Jersey Export Plunges 6%, Amounting to $445M
Italy Jersey Exports
In August 2023, overseas shipments of jerseys, pullovers, cardigans and similar articles increased by 5.4% to 6.9M units, rising for the fourth consecutive month after three months of decline. Over the period under review, exports, however, showed a relatively flat trend pattern. The pace of growth appeared the most rapid in June 2023 when exports increased by 49% month-to-month. Over the period under review, the exports hit record highs at 8.8M units in September 2022; however, from October 2022 to August 2023, the exports remained at a lower figure.
In value terms, jersey exports reduced to $445M (IndexBox estimates) in August 2023. In general, total exports indicated a mild expansion from August 2022 to August 2023: its value increased at an average monthly rate of +1.5% over the last twelve months. The trend pattern, however, indicated some noticeable fluctuations being recorded throughout the analyzed period. Based on August 2023 figures, exports increased by +105.6% against April 2023 indices. The pace of growth appeared the most rapid in May 2023 with an increase of 39% month-to-month. The exports peaked at 471M units in July 2023, and then dropped in the following month.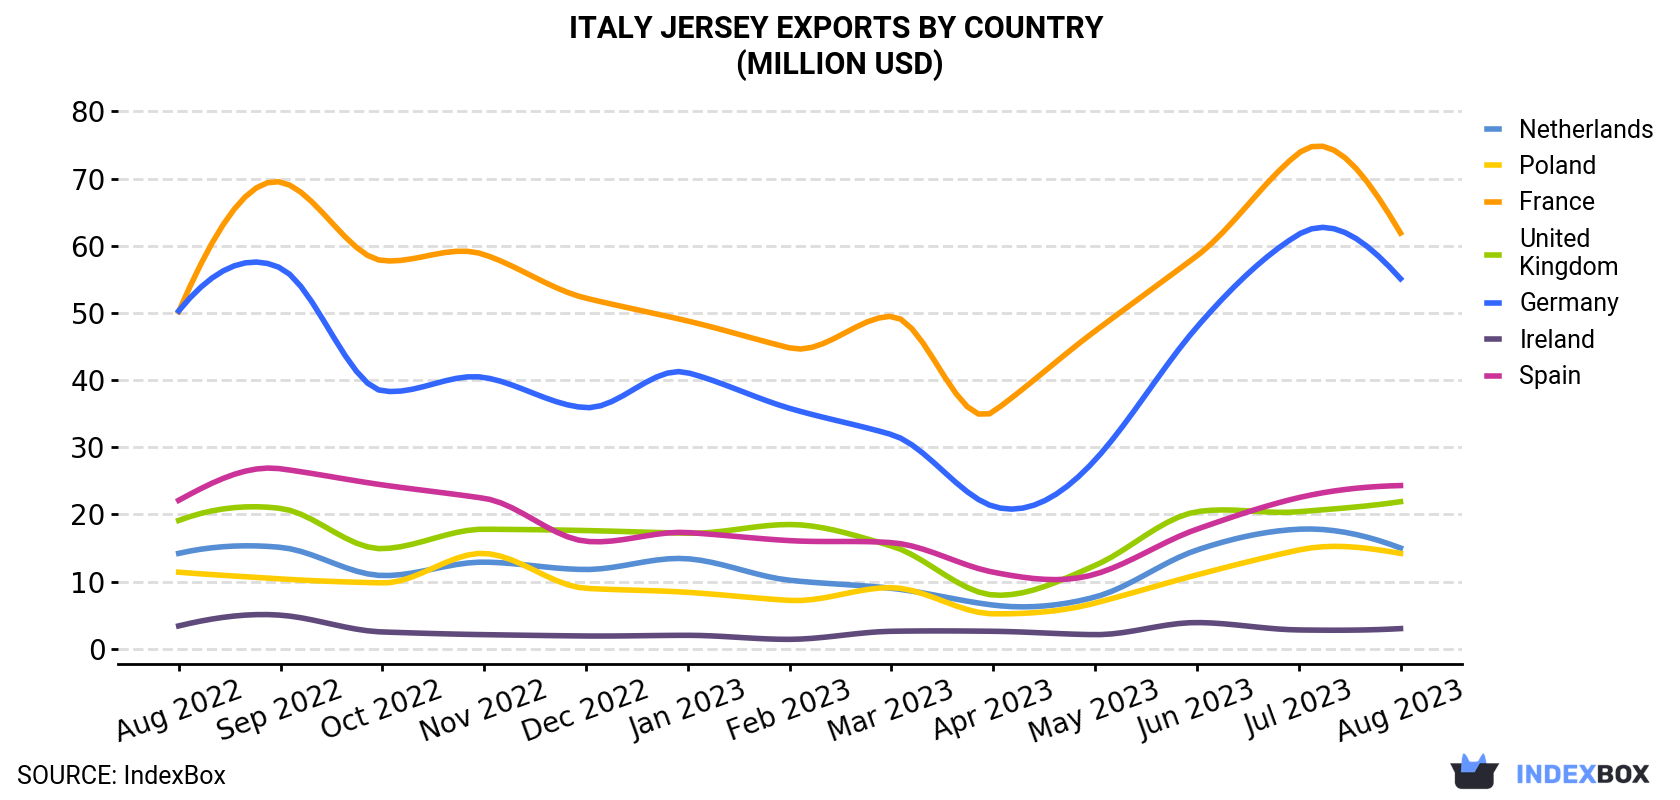
| COUNTRY | Export Value of Jersey in Italy (million USD) | ||||||||||||
|---|---|---|---|---|---|---|---|---|---|---|---|---|---|
| Aug 2022 | Sep 2022 | Oct 2022 | Nov 2022 | Dec 2022 | Jan 2023 | Feb 2023 | Mar 2023 | Apr 2023 | May 2023 | Jun 2023 | Jul 2023 | Aug 2023 | |
| France | 50.2 | 69.5 | 57.8 | 58.7 | 52.2 | 48.8 | 44.8 | 49.5 | 35.3 | 47.3 | 58.5 | 73.8 | 61.9 |
| Germany | 50.3 | 56.7 | 38.4 | 40.4 | 35.9 | 41.1 | 35.8 | 31.9 | 21.2 | 28.1 | 47.9 | 61.7 | 55.1 |
| Spain | 22.1 | 26.8 | 24.4 | 22.4 | 16.0 | 17.3 | 16.1 | 15.8 | 11.4 | 11.1 | 17.8 | 22.5 | 24.3 |
| United Kingdom | 19.1 | 20.9 | 14.9 | 17.8 | 17.6 | 17.2 | 18.5 | 15.3 | 8.0 | 12.4 | 20.4 | 20.4 | 21.9 |
| Netherlands | 14.2 | 15.1 | 10.9 | 12.9 | 11.8 | 13.4 | 10.2 | 9.0 | 6.5 | 7.7 | 14.7 | 17.8 | 15.0 |
| Poland | 11.4 | 10.4 | 9.8 | 14.2 | 9.0 | 8.4 | 7.2 | 9.1 | 5.2 | 6.8 | 11.0 | 14.7 | 14.2 |
| Ireland | 3.4 | 5.0 | 2.5 | 2.1 | 1.9 | 2.0 | 1.4 | 2.6 | 2.6 | 2.1 | 3.9 | 2.8 | 3.0 |
| Others | 201 | 243 | 219 | 219 | 207 | 185 | 178 | 164 | 126 | 186 | 224 | 258 | 250 |
| Total | 372 | 447 | 377 | 387 | 352 | 333 | 312 | 298 | 216 | 302 | 398 | 471 | 445 |
Exports by Country
Germany (1.1M units), France (972K units) and Spain (832K units) were the main destinations of jersey exports from Italy, with a combined 41% share of total exports. These countries were followed by Poland, the UK, the Netherlands and Ireland, which together accounted for a further 16%.
From August 2022 to August 2023, the biggest increases were in Poland (with a CAGR of +1.5%), while shipments for the other leaders experienced mixed trend patterns.
In value terms, France ($62M), Germany ($55M) and Spain ($24M) were the largest markets for jersey exported from Italy worldwide, together comprising 32% of total exports. the UK, the Netherlands, Poland and Ireland lagged somewhat behind, together comprising a further 12%.
Poland, with a CAGR of +1.9%, recorded the highest rates of growth with regard to the value of exports, in terms of the main countries of destination over the period under review, while shipments for the other leaders experienced more modest paces of growth.
Export Prices by Country
In August 2023, the jersey price stood at $64.4 per unit (FOB, Italy), dropping by -10.5% against the previous month. Over the period under review, export price indicated a slight expansion from August 2022 to August 2023: its price increased at an average monthly rate of +1.9% over the last twelve months. The trend pattern, however, indicated some noticeable fluctuations being recorded throughout the analyzed period. Based on August 2023 figures, jersey export price decreased by -25.2% against May 2023 indices. The most prominent rate of growth was recorded in November 2022 when the average export price increased by 21% m-o-m. The export price peaked at $86.1 per unit in May 2023; however, from June 2023 to August 2023, the export prices stood at a somewhat lower figure.
Prices varied noticeably by the country of destination: the country with the highest price was Switzerland ($104 per unit), while the average price for exports to Bulgaria ($15.2 per unit) was amongst the lowest.
From August 2022 to August 2023, the most notable rate of growth in terms of prices was recorded for supplies to Greece (+6.4%), while the prices for the other major destinations experienced more modest paces of growth.
This report provides an in-depth analysis of the jersey market in Italy. Within it, you will discover the latest data on market trends and opportunities by country, consumption, production and price developments, as well as the global trade (imports and exports). The forecast exhibits the market prospects through 2030.
Product coverage:
- Prodcom 14391031 - Men
- Prodcom 14391032 - Women
- Prodcom 14391033 - Jerseys and pullovers, containing . .50 % by weight of wool and weighing . .600 g per article
- Prodcom 14391053 - Lightweight fine knit roll, polo or turtle neck jumpers and pullovers, of cotton
- Prodcom 14391055 - Lightweight fine knit roll, polo or turtle neck jumpers and pullovers, of man-made fibres
- Prodcom 14391061 - Men
- Prodcom 14391062 - Women
- Prodcom 14391071 - Men
- Prodcom 14391072 - Women
- Prodcom 14391090 - Jerseys, pullovers, sweatshirts, waistcoats and cardigans, of textile materials (excluding those of wool or fine animal hair, c otton, man-made fibres)
Country coverage:
- Italy
Data coverage:
- Market volume and value
- Per Capita consumption
- Forecast of the market dynamics in the medium term
- Trade (exports and imports) in Italy
- Export and import prices
- Market trends, drivers and restraints
- Key market players and their profiles
Reasons to buy this report:
- Take advantage of the latest data
- Find deeper insights into current market developments
- Discover vital success factors affecting the market
This report is designed for manufacturers, distributors, importers, and wholesalers, as well as for investors, consultants and advisors.
In this report, you can find information that helps you to make informed decisions on the following issues:
- How to diversify your business and benefit from new market opportunities
- How to load your idle production capacity
- How to boost your sales on overseas markets
- How to increase your profit margins
- How to make your supply chain more sustainable
- How to reduce your production and supply chain costs
- How to outsource production to other countries
- How to prepare your business for global expansion
While doing this research, we combine the accumulated expertise of our analysts and the capabilities of artificial intelligence. The AI-based platform, developed by our data scientists, constitutes the key working tool for business analysts, empowering them to discover deep insights and ideas from the marketing data.
-
1. INTRODUCTION
Making Data-Driven Decisions to Grow Your Business
- REPORT DESCRIPTION
- RESEARCH METHODOLOGY AND AI PLATFORM
- DATA-DRIVEN DECISIONS FOR YOUR BUSINESS
- GLOSSARY AND SPECIFIC TERMS
-
2. EXECUTIVE SUMMARY
A Quick Overview of Market Performance
- KEY FINDINGS
- MARKET TRENDS This Chapter is Available Only for the Professional Edition PRO
-
3. MARKET OVERVIEW
Understanding the Current State of The Market and Its Prospects
- MARKET SIZE
- MARKET STRUCTURE
- TRADE BALANCE
- PER CAPITA CONSUMPTION
- MARKET FORECAST TO 2030
-
4. MOST PROMISING PRODUCT
Finding New Products to Diversify Your Business
This Chapter is Available Only for the Professional Edition PRO- TOP PRODUCTS TO DIVERSIFY YOUR BUSINESS
- BEST-SELLING PRODUCTS
- MOST CONSUMED PRODUCT
- MOST TRADED PRODUCT
- MOST PROFITABLE PRODUCT FOR EXPORT
-
5. MOST PROMISING SUPPLYING COUNTRIES
Choosing the Best Countries to Establish Your Sustainable Supply Chain
This Chapter is Available Only for the Professional Edition PRO- TOP COUNTRIES TO SOURCE YOUR PRODUCT
- TOP PRODUCING COUNTRIES
- TOP EXPORTING COUNTRIES
- LOW-COST EXPORTING COUNTRIES
-
6. MOST PROMISING OVERSEAS MARKETS
Choosing the Best Countries to Boost Your Exports
This Chapter is Available Only for the Professional Edition PRO- TOP OVERSEAS MARKETS FOR EXPORTING YOUR PRODUCT
- TOP CONSUMING MARKETS
- UNSATURATED MARKETS
- TOP IMPORTING MARKETS
- MOST PROFITABLE MARKETS
7. PRODUCTION
The Latest Trends and Insights into The Industry
- PRODUCTION VOLUME AND VALUE
8. IMPORTS
The Largest Import Supplying Countries
- IMPORTS FROM 2012–2023
- IMPORTS BY COUNTRY
- IMPORT PRICES BY COUNTRY
9. EXPORTS
The Largest Destinations for Exports
- EXPORTS FROM 2012–2023
- EXPORTS BY COUNTRY
- EXPORT PRICES BY COUNTRY
-
10. PROFILES OF MAJOR PRODUCERS
The Largest Producers on The Market and Their Profiles
This Chapter is Available Only for the Professional Edition PRO -
LIST OF TABLES
- Key Findings In 2023
- Market Volume, In Physical Terms, 2012–2023
- Market Value, 2012–2023
- Per Capita Consumption In 2012-2023
- Imports, In Physical Terms, By Country, 2012–2023
- Imports, In Value Terms, By Country, 2012–2023
- Import Prices, By Country Of Origin, 2012–2023
- Exports, In Physical Terms, By Country, 2012–2023
- Exports, In Value Terms, By Country, 2012–2023
- Export Prices, By Country Of Destination, 2012–2023
-
LIST OF FIGURES
- Market Volume, In Physical Terms, 2012–2023
- Market Value, 2012–2023
- Market Structure – Domestic Supply vs. Imports, In Physical Terms, 2012-2023
- Market Structure – Domestic Supply vs. Imports, In Value Terms, 2012-2023
- Trade Balance, In Physical Terms, 2012-2023
- Trade Balance, In Value Terms, 2012-2023
- Per Capita Consumption, 2012-2023
- Market Volume Forecast to 2030
- Market Value Forecast to 2030
- Products: Market Size And Growth, By Type
- Products: Average Per Capita Consumption, By Type
- Products: Exports And Growth, By Type
- Products: Export Prices And Growth, By Type
- Production Volume And Growth
- Exports And Growth
- Export Prices And Growth
- Market Size And Growth
- Per Capita Consumption
- Imports And Growth
- Import Prices
- Production, In Physical Terms, 2012–2023
- Production, In Value Terms, 2012–2023
- Imports, In Physical Terms, 2012–2023
- Imports, In Value Terms, 2012–2023
- Imports, In Physical Terms, By Country, 2023
- Imports, In Physical Terms, By Country, 2012–2023
- Imports, In Value Terms, By Country, 2012–2023
- Import Prices, By Country Of Origin, 2012–2023
- Exports, In Physical Terms, 2012–2023
- Exports, In Value Terms, 2012–2023
- Exports, In Physical Terms, By Country, 2023
- Exports, In Physical Terms, By Country, 2012–2023
- Exports, In Value Terms, By Country, 2012–2023
- Export Prices, By Country Of Destination, 2012–2023


