
Poland - Electric Lamps - Market Analysis, Forecast, Size, Trends and Insights
Get instant access to more than 2 million reports, dashboards, and datasets on the IndexBox Platform.
View PricingPoland's Exports of Lamps Increase to $344M in 2023
Poland Electric Lamp Exports
In 2023, shipments abroad of electric lamps decreased by -12.2% to 292M units, falling for the second year in a row after two years of growth. Over the period under review, exports faced a deep reduction. The pace of growth was the most pronounced in 2020 when exports increased by 23% against the previous year. The exports peaked at 943M units in 2013; however, from 2014 to 2023, the exports remained at a lower figure.
In value terms, electric lamp exports rose modestly to $344M (IndexBox estimates) in 2023. In general, exports continue to indicate a abrupt decrease. The most prominent rate of growth was recorded in 2020 with an increase of 75%. Over the period under review, the exports reached the peak figure at $888M in 2013; however, from 2014 to 2023, the exports remained at a lower figure.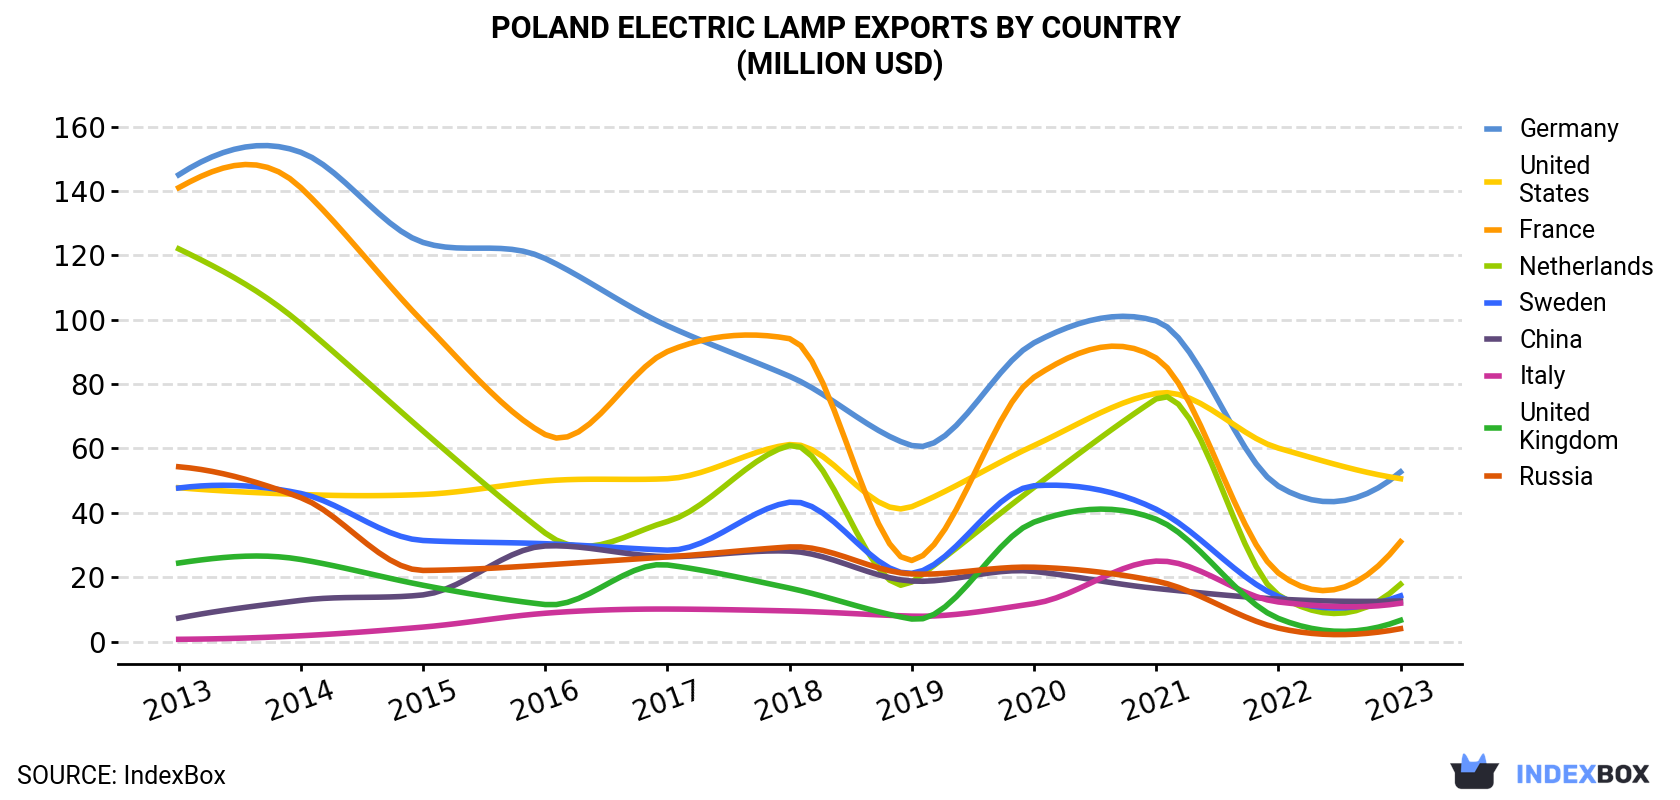
| COUNTRY | Export Value of Electric Lamp in Poland (million USD) | ||||||||||
|---|---|---|---|---|---|---|---|---|---|---|---|
| 2013 | 2014 | 2015 | 2016 | 2017 | 2018 | 2019 | 2020 | 2021 | 2022 | 2023 | |
| Germany | 145 | 152 | 124 | 119 | 98.1 | 82.4 | 60.9 | 92.8 | 99.6 | 48.3 | 52.7 |
| United States | 47.8 | 45.7 | 45.7 | 49.9 | 50.6 | 61.2 | 41.9 | 60.9 | 77.1 | 60.1 | 50.6 |
| France | 141 | 141 | 99.3 | 64.3 | 90.1 | 94.1 | 25.2 | 82.1 | 88.1 | 21.3 | 31.0 |
| Netherlands | 122 | 98.7 | 65.4 | 33.7 | 37.3 | 60.9 | 18.5 | 47.9 | 75.4 | 14.5 | 17.8 |
| Sweden | 47.7 | 46.0 | 31.4 | 30.4 | 28.4 | 43.3 | 21.2 | 48.4 | 41.1 | 14.0 | 14.2 |
| China | 7.3 | 12.8 | 14.5 | 29.7 | 26.4 | 28.1 | 18.8 | 21.8 | 16.5 | 13.2 | 12.6 |
| Italy | 0.7 | 1.8 | 4.5 | 8.8 | 10.1 | 9.5 | 7.9 | 11.8 | 25.0 | 12.3 | 11.9 |
| United Kingdom | 24.4 | 25.5 | 17.5 | 11.5 | 23.8 | 16.6 | 7.0 | 37.1 | 38.0 | 7.2 | 6.6 |
| Russia | 54.3 | 44.7 | 22.1 | 23.8 | 26.3 | 29.4 | 21.0 | 23.1 | 18.8 | 4.2 | 4.0 |
| Others | 298 | 263 | 220 | 190 | 273 | 257 | 149 | 224 | 244 | 136 | 142 |
| Total | 888 | 831 | 644 | 562 | 664 | 683 | 371 | 650 | 723 | 331 | 344 |
Exports by Country
Germany (36M units), France (35M units) and the United States (29M units) were the main destinations of electric lamp exports from Poland, together comprising 34% of total exports. the Netherlands, Italy, China, Sweden, the UK and Russia lagged somewhat behind, together accounting for a further 15%.
From 2013 to 2023, the biggest increases were recorded for Italy (with a CAGR of +25.8%), while shipments for the other leaders experienced mixed trend patterns.
In value terms, Germany ($53M), the United States ($51M) and France ($31M) appeared to be the largest markets for electric lamp exported from Poland worldwide, together comprising 39% of total exports. the Netherlands, Sweden, China, Italy, the UK and Russia lagged somewhat behind, together accounting for a further 20%.
Italy, with a CAGR of +32.0%, recorded the highest growth rate of the value of exports, in terms of the main countries of destination over the period under review, while shipments for the other leaders experienced more modest paces of growth.
Exports by Type
Electric filament lamps (189M units), fluorescent discharge lamps (174M units) and LED lamps (131M units) were the main products of electric lamp exports from Poland, with a combined 85% share of total exports.
From 2013 to 2021, the most notable rate of growth in terms of shipments, amongst the major product types, was attained by LED lamps (with a CAGR of +25.7%), while the other products experienced mixed trend patterns.
In value terms, LED lamps ($335M) remains the largest type of electric lamps exported from Poland, comprising 46% of total exports. The second position in the ranking was taken by fluorescent discharge lamps ($152M), with a 21% share of total exports. It was followed by tungsten halogen lamps, with a 16% share.
From 2013 to 2021, the average annual rate of growth in terms of the value of LED lamps exports totaled +17.4%. With regard to the other exported products, the following average annual rates of growth were recorded: fluorescent discharge lamps (-13.1% per year) and tungsten halogen lamps (-10.1% per year).
Export Prices by Country
In 2023, the electric lamp price stood at $1.2 per unit (FOB, Poland), picking up by 18% against the previous year. Over the last decade, it increased at an average annual rate of +2.3%. The pace of growth appeared the most rapid in 2020 when the average export price increased by 42% against the previous year. Over the period under review, the average export prices hit record highs at $1.2 per unit in 2021; afterwards, it flattened through to 2023.
Prices varied noticeably by country of destination: amid the top suppliers, the country with the highest price was Sweden ($1.8 per unit), while the average price for exports to Turkey ($0.4 per unit) was amongst the lowest.
From 2013 to 2023, the most notable rate of growth in terms of prices was recorded for supplies to Brazil (+9.4%), while the prices for the other major destinations experienced more modest paces of growth.
This report provides an in-depth analysis of the electric lamp market in Poland. Within it, you will discover the latest data on market trends and opportunities by country, consumption, production and price developments, as well as the global trade (imports and exports). The forecast exhibits the market prospects through 2030.
Product coverage:
- Prodcom 27401100 - Sealed beam lamp units
- Prodcom 27401250 - Tungsten halogen filament lamps for motorcycles and motor vehicles (excluding ultraviolet and infrared lamps)
- Prodcom 27401293 - Tungsten halogen filament lamps, for a voltage > .100 V (excluding ultraviolet and infra-red lamps, for motorcycles and motor vehicles)
- Prodcom 27401295 - Tungsten halogen filament lamps for a voltage . .100 V (excluding ultraviolet and infrared lamps, for motorcycles and motor vehicles)
- Prodcom 27401300 - Filament lamps of a power . .200 W and for a voltage > .100 V including reflector lamps (excluding ultraviolet, infrared lamps, t ungsten halogen filament lamps and sealed beam lamp units)
- Prodcom 27401460 - Filament lamps for motorcycles or other motor vehicles excluding sealed beam lamp units, tungsten halogen lamps
- Prodcom 27401490 - Filament lamps n.e.c.
- Prodcom 27401510 - Fluorescent hot cathode discharge lamps, with double ended cap (excluding ultraviolet lamps)
- Prodcom 27401530 - Fluorescent hot cathode discharge lamps (excluding ultraviolet lamps, with double ended cap)
- Prodcom 27401550 - Other discharge lamps (excluding ultraviolet lamps)
- Prodcom 27401570 - Ultraviolet or infrared lamps, arc lamps
- Prodcom 27403090 -
Country coverage:
- Poland
Data coverage:
- Market volume and value
- Per Capita consumption
- Forecast of the market dynamics in the medium term
- Trade (exports and imports) in Poland
- Export and import prices
- Market trends, drivers and restraints
- Key market players and their profiles
Reasons to buy this report:
- Take advantage of the latest data
- Find deeper insights into current market developments
- Discover vital success factors affecting the market
This report is designed for manufacturers, distributors, importers, and wholesalers, as well as for investors, consultants and advisors.
In this report, you can find information that helps you to make informed decisions on the following issues:
- How to diversify your business and benefit from new market opportunities
- How to load your idle production capacity
- How to boost your sales on overseas markets
- How to increase your profit margins
- How to make your supply chain more sustainable
- How to reduce your production and supply chain costs
- How to outsource production to other countries
- How to prepare your business for global expansion
While doing this research, we combine the accumulated expertise of our analysts and the capabilities of artificial intelligence. The AI-based platform, developed by our data scientists, constitutes the key working tool for business analysts, empowering them to discover deep insights and ideas from the marketing data.
-
1. INTRODUCTION
Making Data-Driven Decisions to Grow Your Business
- REPORT DESCRIPTION
- RESEARCH METHODOLOGY AND AI PLATFORM
- DATA-DRIVEN DECISIONS FOR YOUR BUSINESS
- GLOSSARY AND SPECIFIC TERMS
-
2. EXECUTIVE SUMMARY
A Quick Overview of Market Performance
- KEY FINDINGS
- MARKET TRENDS This Chapter is Available Only for the Professional Edition PRO
-
3. MARKET OVERVIEW
Understanding the Current State of The Market and Its Prospects
- MARKET SIZE
- MARKET STRUCTURE
- TRADE BALANCE
- PER CAPITA CONSUMPTION
- MARKET FORECAST TO 2030
-
4. MOST PROMISING PRODUCT
Finding New Products to Diversify Your Business
This Chapter is Available Only for the Professional Edition PRO- TOP PRODUCTS TO DIVERSIFY YOUR BUSINESS
- BEST-SELLING PRODUCTS
- MOST CONSUMED PRODUCT
- MOST TRADED PRODUCT
- MOST PROFITABLE PRODUCT FOR EXPORT
-
5. MOST PROMISING SUPPLYING COUNTRIES
Choosing the Best Countries to Establish Your Sustainable Supply Chain
This Chapter is Available Only for the Professional Edition PRO- TOP COUNTRIES TO SOURCE YOUR PRODUCT
- TOP PRODUCING COUNTRIES
- TOP EXPORTING COUNTRIES
- LOW-COST EXPORTING COUNTRIES
-
6. MOST PROMISING OVERSEAS MARKETS
Choosing the Best Countries to Boost Your Exports
This Chapter is Available Only for the Professional Edition PRO- TOP OVERSEAS MARKETS FOR EXPORTING YOUR PRODUCT
- TOP CONSUMING MARKETS
- UNSATURATED MARKETS
- TOP IMPORTING MARKETS
- MOST PROFITABLE MARKETS
7. PRODUCTION
The Latest Trends and Insights into The Industry
- PRODUCTION VOLUME AND VALUE
8. IMPORTS
The Largest Import Supplying Countries
- IMPORTS FROM 2012–2023
- IMPORTS BY COUNTRY
- IMPORT PRICES BY COUNTRY
9. EXPORTS
The Largest Destinations for Exports
- EXPORTS FROM 2012–2023
- EXPORTS BY COUNTRY
- EXPORT PRICES BY COUNTRY
-
10. PROFILES OF MAJOR PRODUCERS
The Largest Producers on The Market and Their Profiles
This Chapter is Available Only for the Professional Edition PRO -
LIST OF TABLES
- Key Findings In 2023
- Market Volume, In Physical Terms, 2012–2023
- Market Value, 2012–2023
- Per Capita Consumption In 2012-2023
- Imports, In Physical Terms, By Country, 2012–2023
- Imports, In Value Terms, By Country, 2012–2023
- Import Prices, By Country Of Origin, 2012–2023
- Exports, In Physical Terms, By Country, 2012–2023
- Exports, In Value Terms, By Country, 2012–2023
- Export Prices, By Country Of Destination, 2012–2023
-
LIST OF FIGURES
- Market Volume, In Physical Terms, 2012–2023
- Market Value, 2012–2023
- Market Structure – Domestic Supply vs. Imports, In Physical Terms, 2012-2023
- Market Structure – Domestic Supply vs. Imports, In Value Terms, 2012-2023
- Trade Balance, In Physical Terms, 2012-2023
- Trade Balance, In Value Terms, 2012-2023
- Per Capita Consumption, 2012-2023
- Market Volume Forecast to 2030
- Market Value Forecast to 2030
- Products: Market Size And Growth, By Type
- Products: Average Per Capita Consumption, By Type
- Products: Exports And Growth, By Type
- Products: Export Prices And Growth, By Type
- Production Volume And Growth
- Exports And Growth
- Export Prices And Growth
- Market Size And Growth
- Per Capita Consumption
- Imports And Growth
- Import Prices
- Production, In Physical Terms, 2012–2023
- Production, In Value Terms, 2012–2023
- Imports, In Physical Terms, 2012–2023
- Imports, In Value Terms, 2012–2023
- Imports, In Physical Terms, By Country, 2023
- Imports, In Physical Terms, By Country, 2012–2023
- Imports, In Value Terms, By Country, 2012–2023
- Import Prices, By Country Of Origin, 2012–2023
- Exports, In Physical Terms, 2012–2023
- Exports, In Value Terms, 2012–2023
- Exports, In Physical Terms, By Country, 2023
- Exports, In Physical Terms, By Country, 2012–2023
- Exports, In Value Terms, By Country, 2012–2023
- Export Prices, By Country Of Destination, 2012–2023


