
Thailand - Tyres - Market Analysis, Forecast, Size, Trends and Insights
Get instant access to more than 2 million reports, dashboards, and datasets on the IndexBox Platform.
View PricingExport of Tires From Thailand Increases to $7 Billion Following Three Consecutive Months of Growth in 2023
Thailand Tyre Exports
Tyre exports from Thailand stood at 139M units in 2023, remaining stable against 2022 figures. The total export volume increased at an average annual rate of +4.4% from 2013 to 2023; however, the trend pattern indicated some noticeable fluctuations being recorded in certain years. The pace of growth appeared the most rapid in 2021 when exports increased by 13%. As a result, the exports attained the peak of 150M units. From 2022 to 2023, the growth of the exports remained at a lower figure.
In value terms, tyre exports rose rapidly to $7B (IndexBox estimates) in 2023. In general, exports posted buoyant growth. The growth pace was the most rapid in 2017 when exports increased by 23% against the previous year. The exports peaked in 2023 and are likely to see steady growth in years to come.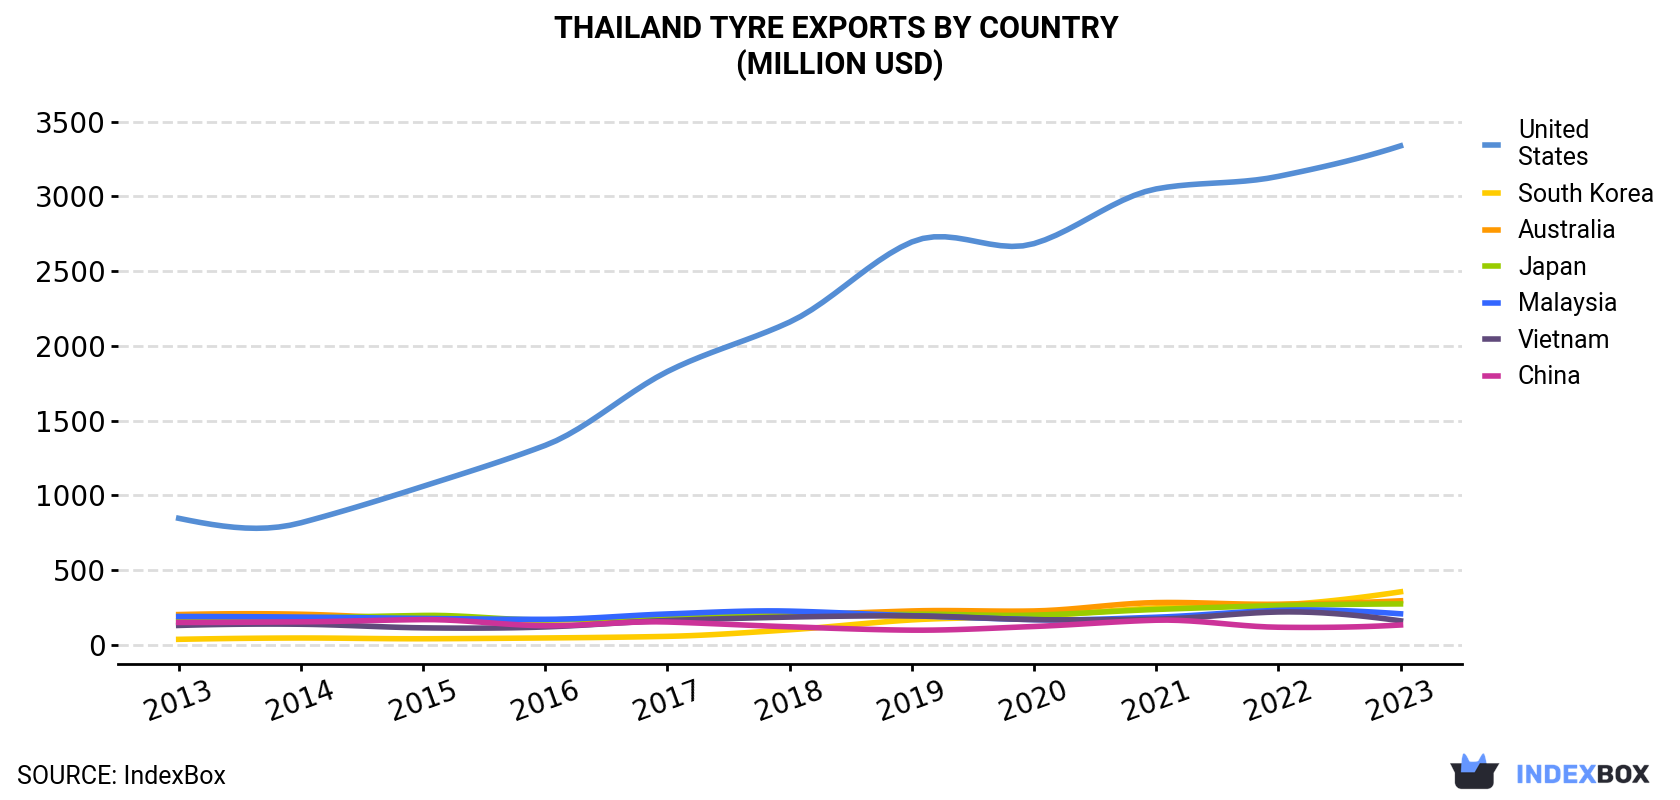
| COUNTRY | Export Value of Tyre in Thailand (million USD) | ||||||||||
|---|---|---|---|---|---|---|---|---|---|---|---|
| 2013 | 2014 | 2015 | 2016 | 2017 | 2018 | 2019 | 2020 | 2021 | 2022 | 2023 | |
| United States | 846 | 816 | 1,060 | 1,334 | 1,828 | 2,159 | 2,695 | 2,684 | 3,050 | 3,134 | 3,338 |
| South Korea | 36.1 | 44.9 | 39.9 | 45.3 | 56.0 | 100 | 166 | 191 | 247 | 266 | 354 |
| Australia | 202 | 204 | 174 | 166 | 179 | 199 | 226 | 226 | 282 | 271 | 294 |
| Japan | 159 | 179 | 196 | 166 | 192 | 191 | 204 | 198 | 236 | 262 | 273 |
| Malaysia | 189 | 185 | 176 | 170 | 206 | 225 | 194 | 168 | 184 | 230 | 207 |
| Vietnam | 129 | 137 | 113 | 119 | 162 | 185 | 193 | 168 | 171 | 219 | 160 |
| China | 149 | 153 | 168 | 127 | 152 | 120 | 97.4 | 122 | 164 | 117 | 132 |
| Others | 1,728 | 1,788 | 1,529 | 1,452 | 1,623 | 1,763 | 1,824 | 1,496 | 1,932 | 2,129 | 2,274 |
| Total | 3,438 | 3,506 | 3,457 | 3,579 | 4,399 | 4,943 | 5,600 | 5,252 | 6,265 | 6,628 | 7,032 |
Exports by Country
the United States (61M units) was the main destination for tyre exports from Thailand, accounting for a 44% share of total exports. Moreover, tyre exports to the United States exceeded the volume sent to the second major destination, Japan (6.4M units), tenfold. The third position in this ranking was held by Malaysia (5.4M units), with a 3.9% share.
From 2013 to 2023, the average annual rate of growth in terms of volume to the United States stood at +14.8%. Exports to the other major destinations recorded the following average annual rates of exports growth: Japan (+3.9% per year) and Malaysia (-1.2% per year).
In value terms, the United States ($3.3B) remains the key foreign market for tyres exports from Thailand, comprising 47% of total exports. The second position in the ranking was held by South Korea ($354M), with a 5% share of total exports. It was followed by Australia, with a 4.2% share.
From 2013 to 2023, the average annual growth rate of value to the United States stood at +14.7%. Exports to the other major destinations recorded the following average annual rates of exports growth: South Korea (+25.6% per year) and Australia (+3.9% per year).
Exports by Type
Tyres for motor cars (79M units) was the largest type of tyres exported from Thailand, accounting for a 57% share of total exports. Moreover, tyres for motor cars exceeded the volume of the second product type, tyres for buses or lorries (29M units), threefold. The third position in this ranking was taken by tyres for motorcycles or bicycles (27M units), with a 19% share.
From 2013 to 2023, the average annual growth rate of the volume of tyres for motor cars exports amounted to +7.0%. With regard to the other exported products, the following average annual rates of growth were recorded: tyres for buses or lorries (+12.1% per year) and tyres for motorcycles or bicycles (-3.2% per year).
In value terms, tyres with the largest exports in Thailand were tyres for motor cars ($3.3B), tyres for buses or lorries ($3B) and tyres for agriculture, forestry, construction, industry and other off the road vehicles ($265M), together comprising 93% of total exports. Tyres for aircraft and tyres for motorcycles or bicycles lagged somewhat behind, together accounting for a further 7%.
In terms of the main product categories, tyres for aircraft, with a CAGR of +10.7%, recorded the highest rates of growth with regard to the value of exports, over the period under review, while shipments for the other products experienced more modest paces of growth.
Export Prices by Country
In 2023, the tyre price stood at $51 per unit (FOB, Thailand), growing by 4.7% against the previous year. In general, export price indicated pronounced growth from 2013 to 2023: its price increased at an average annual rate of +2.9% over the last decade. The trend pattern, however, indicated some noticeable fluctuations being recorded throughout the analyzed period. Based on 2023 figures, tyre export price increased by +6.6% against 2019 indices. The most prominent rate of growth was recorded in 2019 an increase of 26%. Over the period under review, the average export prices reached the peak figure in 2023 and is likely to see steady growth in the immediate term.
Prices varied noticeably by country of destination: amid the top suppliers, the country with the highest price was South Korea ($79 per unit), while the average price for exports to Myanmar ($9 per unit) was amongst the lowest.
From 2013 to 2023, the most notable rate of growth in terms of prices was recorded for supplies to France (+10.1%), while the prices for the other major destinations experienced more modest paces of growth.
This report provides an in-depth analysis of the tyre market in Thailand. Within it, you will discover the latest data on market trends and opportunities by country, consumption, production and price developments, as well as the global trade (imports and exports). The forecast exhibits the market prospects through 2030.
Product coverage:
- Prodcom 22111100 - New pneumatic rubber tyres for motor cars (including for racing cars)
- Prodcom 22111355 - New pneumatic rubber tyres for buses or lorries with a load index . .121
- Prodcom 22111357 - New pneumatic rubber tyres for buses or lorries with a load index > .121
- Prodcom 22111370 - New pneumatic rubber tyres for aircraft
- Prodcom 22111200 - New pneumatic tyres, of rubber, of a kind used on motorcycles or bicycles
- Prodcom 22111400 - Agrarian tyres, other new pneumatic tyres, of rubber
Country coverage:
- Thailand
Data coverage:
- Market volume and value
- Per Capita consumption
- Forecast of the market dynamics in the medium term
- Trade (exports and imports) in Thailand
- Export and import prices
- Market trends, drivers and restraints
- Key market players and their profiles
Reasons to buy this report:
- Take advantage of the latest data
- Find deeper insights into current market developments
- Discover vital success factors affecting the market
This report is designed for manufacturers, distributors, importers, and wholesalers, as well as for investors, consultants and advisors.
In this report, you can find information that helps you to make informed decisions on the following issues:
- How to diversify your business and benefit from new market opportunities
- How to load your idle production capacity
- How to boost your sales on overseas markets
- How to increase your profit margins
- How to make your supply chain more sustainable
- How to reduce your production and supply chain costs
- How to outsource production to other countries
- How to prepare your business for global expansion
While doing this research, we combine the accumulated expertise of our analysts and the capabilities of artificial intelligence. The AI-based platform, developed by our data scientists, constitutes the key working tool for business analysts, empowering them to discover deep insights and ideas from the marketing data.
-
1. INTRODUCTION
Making Data-Driven Decisions to Grow Your Business
- REPORT DESCRIPTION
- RESEARCH METHODOLOGY AND AI PLATFORM
- DATA-DRIVEN DECISIONS FOR YOUR BUSINESS
- GLOSSARY AND SPECIFIC TERMS
-
2. EXECUTIVE SUMMARY
A Quick Overview of Market Performance
- KEY FINDINGS
- MARKET TRENDS This Chapter is Available Only for the Professional Edition PRO
-
3. MARKET OVERVIEW
Understanding the Current State of The Market and Its Prospects
- MARKET SIZE
- MARKET STRUCTURE
- TRADE BALANCE
- PER CAPITA CONSUMPTION
- MARKET FORECAST TO 2030
-
4. MOST PROMISING PRODUCT
Finding New Products to Diversify Your Business
This Chapter is Available Only for the Professional Edition PRO- TOP PRODUCTS TO DIVERSIFY YOUR BUSINESS
- BEST-SELLING PRODUCTS
- MOST CONSUMED PRODUCT
- MOST TRADED PRODUCT
- MOST PROFITABLE PRODUCT FOR EXPORT
-
5. MOST PROMISING SUPPLYING COUNTRIES
Choosing the Best Countries to Establish Your Sustainable Supply Chain
This Chapter is Available Only for the Professional Edition PRO- TOP COUNTRIES TO SOURCE YOUR PRODUCT
- TOP PRODUCING COUNTRIES
- TOP EXPORTING COUNTRIES
- LOW-COST EXPORTING COUNTRIES
-
6. MOST PROMISING OVERSEAS MARKETS
Choosing the Best Countries to Boost Your Exports
This Chapter is Available Only for the Professional Edition PRO- TOP OVERSEAS MARKETS FOR EXPORTING YOUR PRODUCT
- TOP CONSUMING MARKETS
- UNSATURATED MARKETS
- TOP IMPORTING MARKETS
- MOST PROFITABLE MARKETS
7. PRODUCTION
The Latest Trends and Insights into The Industry
- PRODUCTION VOLUME AND VALUE
8. IMPORTS
The Largest Import Supplying Countries
- IMPORTS FROM 2012–2023
- IMPORTS BY COUNTRY
- IMPORT PRICES BY COUNTRY
9. EXPORTS
The Largest Destinations for Exports
- EXPORTS FROM 2012–2023
- EXPORTS BY COUNTRY
- EXPORT PRICES BY COUNTRY
-
10. PROFILES OF MAJOR PRODUCERS
The Largest Producers on The Market and Their Profiles
This Chapter is Available Only for the Professional Edition PRO -
LIST OF TABLES
- Key Findings In 2023
- Market Volume, In Physical Terms, 2012–2023
- Market Value, 2012–2023
- Per Capita Consumption In 2012-2023
- Imports, In Physical Terms, By Country, 2012–2023
- Imports, In Value Terms, By Country, 2012–2023
- Import Prices, By Country Of Origin, 2012–2023
- Exports, In Physical Terms, By Country, 2012–2023
- Exports, In Value Terms, By Country, 2012–2023
- Export Prices, By Country Of Destination, 2012–2023
-
LIST OF FIGURES
- Market Volume, In Physical Terms, 2012–2023
- Market Value, 2012–2023
- Market Structure – Domestic Supply vs. Imports, In Physical Terms, 2012-2023
- Market Structure – Domestic Supply vs. Imports, In Value Terms, 2012-2023
- Trade Balance, In Physical Terms, 2012-2023
- Trade Balance, In Value Terms, 2012-2023
- Per Capita Consumption, 2012-2023
- Market Volume Forecast to 2030
- Market Value Forecast to 2030
- Products: Market Size And Growth, By Type
- Products: Average Per Capita Consumption, By Type
- Products: Exports And Growth, By Type
- Products: Export Prices And Growth, By Type
- Production Volume And Growth
- Exports And Growth
- Export Prices And Growth
- Market Size And Growth
- Per Capita Consumption
- Imports And Growth
- Import Prices
- Production, In Physical Terms, 2012–2023
- Production, In Value Terms, 2012–2023
- Imports, In Physical Terms, 2012–2023
- Imports, In Value Terms, 2012–2023
- Imports, In Physical Terms, By Country, 2023
- Imports, In Physical Terms, By Country, 2012–2023
- Imports, In Value Terms, By Country, 2012–2023
- Import Prices, By Country Of Origin, 2012–2023
- Exports, In Physical Terms, 2012–2023
- Exports, In Value Terms, 2012–2023
- Exports, In Physical Terms, By Country, 2023
- Exports, In Physical Terms, By Country, 2012–2023
- Exports, In Value Terms, By Country, 2012–2023
- Export Prices, By Country Of Destination, 2012–2023


