
Turkey - Table Linen, Knitted Or Crocheted - Market Analysis, Forecast, Size, Trends and Insights
Get instant access to more than 2 million reports, dashboards, and datasets on the IndexBox Platform.
View PricingExport of Table Linen in Turkey Sees Marginal Increase, Reaching $3.3M for July 2023
Turkey Table Linen Exports
In July 2023, after two months of growth, there was decline in overseas shipments of table linen, knitted or crocheted, when their volume decreased by -4.2% to 379 tons. The total export volume increased at an average monthly rate of +1.6% from July 2022 to July 2023; however, the trend pattern indicated some noticeable fluctuations being recorded throughout the analyzed period. The pace of growth was the most pronounced in August 2022 with an increase of 29% m-o-m.
In value terms, table linen exports totaled $3.3M (IndexBox estimates) in July 2023. The total export value increased at an average monthly rate of +3.3% over the period from July 2022 to July 2023; however, the trend pattern indicated some noticeable fluctuations being recorded in certain months. The most prominent rate of growth was recorded in August 2022 when exports increased by 41% month-to-month. 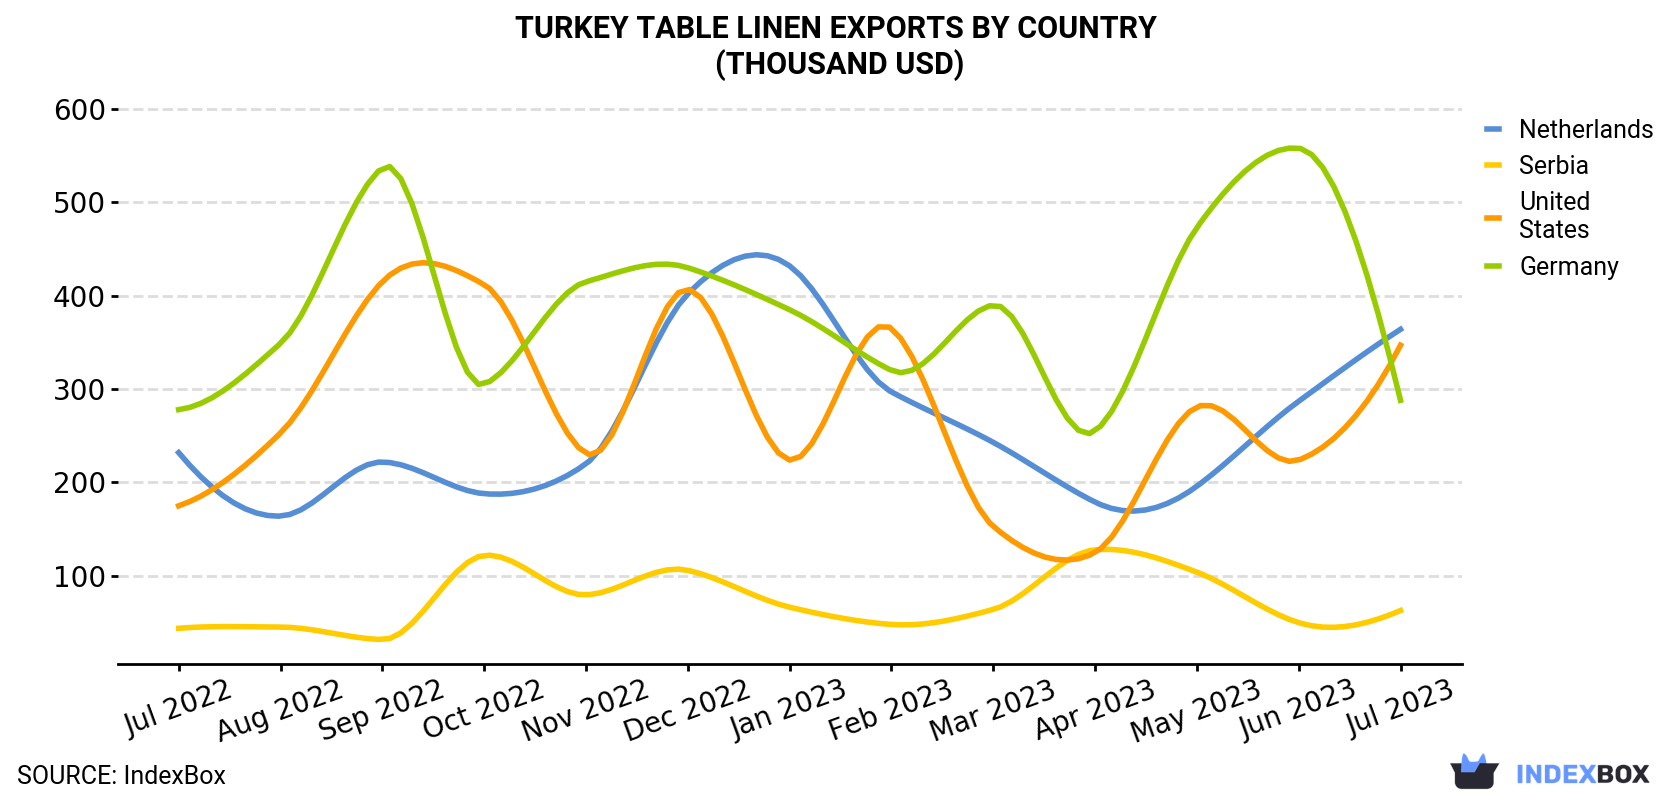
| COUNTRY | Export Value of Table Linen in Turkey (thousand USD) | ||||||||||||
|---|---|---|---|---|---|---|---|---|---|---|---|---|---|
| Jul 2022 | Aug 2022 | Sep 2022 | Oct 2022 | Nov 2022 | Dec 2022 | Jan 2023 | Feb 2023 | Mar 2023 | Apr 2023 | May 2023 | Jun 2023 | Jul 2023 | |
| Netherlands | 232 | 164 | 222 | 188 | 220 | 402 | 432 | 297 | 243 | 179 | 196 | 287 | 364 |
| United States | 175 | 253 | 415 | 412 | 231 | 407 | 224 | 365 | 153 | 125 | 281 | 224 | 347 |
| Germany | 278 | 349 | 537 | 305 | 415 | 430 | 385 | 320 | 390 | 255 | 473 | 558 | 288 |
| Serbia | 43.9 | 45.2 | 31.8 | 122 | 79.7 | 106 | 66.5 | 48.0 | 64.1 | 128 | 104 | 49.9 | 62.9 |
| Others | 1,501 | 2,332 | 2,390 | 2,474 | 2,299 | 1,803 | 1,810 | 2,140 | 2,871 | 2,172 | 1,891 | 2,106 | 2,214 |
| Total | 2,230 | 3,142 | 3,595 | 3,501 | 3,244 | 3,147 | 2,917 | 3,170 | 3,721 | 2,859 | 2,945 | 3,225 | 3,276 |
Exports by Country
The Netherlands (80 tons) was the main destination for table linen exports from Turkey, accounting for a 21% share of total exports. Moreover, table linen exports to the Netherlands exceeded the volume sent to the second major destination, Germany (25 tons), threefold. The United States (25 tons) ranked third in terms of total exports with a 6.5% share.
From July 2022 to July 2023, the average monthly growth rate of volume to the Netherlands totaled +2.4%. Exports to the other major destinations recorded the following average monthly rates of exports growth: Germany (-0.5% per month) and the United States (+5.9% per month).
In value terms, the Netherlands ($364K), the United States ($347K) and Germany ($288K) were the largest markets for table linen exported from Turkey worldwide, with a combined 30% share of total exports.
The United States, with a CAGR of +5.9%, saw the highest rates of growth with regard to the value of exports, among the main countries of destination over the period under review, while shipments for the other leaders experienced more modest paces of growth.
Exports by Type
Table linen; of man-made fibres, not knitted or crocheted (188 tons) was the largest type of table linen exported from Turkey, accounting for a 50% share of total exports. Moreover, table linen; of man-made fibres, not knitted or crocheted exceeded the volume of the second product type, table linen of cotton (92 tons), twofold. Table linen of knitted or crocheted textiles (65 tons) ranked third in terms of total exports with a 17% share.
From July 2022 to July 2023, the average monthly rate of growth in terms of the volume of export of table linen; of man-made fibres, not knitted or crocheted amounted to +2.7%. With regard to the other exported products, the following average monthly rates of growth were recorded: table linen of cotton (+1.2% per month) and table linen of knitted or crocheted textiles (-0.7% per month).
In value terms, the most traded types of table linen, knitted or crocheted in Turkey were table linen; of man-made fibres, not knitted or crocheted ($1.3M), table linen of cotton ($1.2M) and table linen; of textile materials (other than cotton, flax or man-made fibres), not knitted or crocheted ($464K), together comprising 89% of total exports.
In terms of the main product categories, table linen; of textile materials (other than cotton, flax or man-made fibres), not knitted or crocheted, with a CAGR of +8.2%, saw the highest growth rate of the value of exports, over the period under review, while shipments for the other products experienced more modest paces of growth.
Export Prices by Country
In July 2023, the table linen price amounted to $8,639 per ton (FOB, Turkey), with an increase of 6.1% against the previous month. Over the period from July 2022 to July 2023, it increased at an average monthly rate of +1.6%. The pace of growth appeared the most rapid in January 2023 when the average export price increased by 18% against the previous month. Over the period under review, the average export prices attained the maximum at $8,875 per ton in April 2023; however, from May 2023 to July 2023, the export prices remained at a lower figure.
Prices varied noticeably by the country of destination: the country with the highest price was France ($31,028 per ton), while the average price for exports to Serbia ($3,221 per ton) was amongst the lowest.
From July 2022 to July 2023, the most notable rate of growth in terms of prices was recorded for supplies to France (+9.2%), while the prices for the other major destinations experienced more modest paces of growth.
This report provides an in-depth analysis of the table linen market in Turkey. Within it, you will discover the latest data on market trends and opportunities by country, consumption, production and price developments, as well as the global trade (imports and exports). The forecast exhibits the market prospects through 2030.
Product coverage:
- Prodcom 13921330 - Table linen of knitted or crocheted textiles
- Prodcom 13921353 - Table linen of cotton (excluding knitted or crocheted)
- Prodcom 13921355 - Table linen of flax (excluding knitted or crocheted)
- Prodcom 13921359 - Table linen of woven man-made fibres and of other woven or non-woven textiles (excluding of cotton, of flax)
- Prodcom 13921370 - Table linen of non-woven man-made fibres
Country coverage:
- Turkey
Data coverage:
- Market volume and value
- Per Capita consumption
- Forecast of the market dynamics in the medium term
- Trade (exports and imports) in Turkey
- Export and import prices
- Market trends, drivers and restraints
- Key market players and their profiles
Reasons to buy this report:
- Take advantage of the latest data
- Find deeper insights into current market developments
- Discover vital success factors affecting the market
This report is designed for manufacturers, distributors, importers, and wholesalers, as well as for investors, consultants and advisors.
In this report, you can find information that helps you to make informed decisions on the following issues:
- How to diversify your business and benefit from new market opportunities
- How to load your idle production capacity
- How to boost your sales on overseas markets
- How to increase your profit margins
- How to make your supply chain more sustainable
- How to reduce your production and supply chain costs
- How to outsource production to other countries
- How to prepare your business for global expansion
While doing this research, we combine the accumulated expertise of our analysts and the capabilities of artificial intelligence. The AI-based platform, developed by our data scientists, constitutes the key working tool for business analysts, empowering them to discover deep insights and ideas from the marketing data.
-
1. INTRODUCTION
Making Data-Driven Decisions to Grow Your Business
- REPORT DESCRIPTION
- RESEARCH METHODOLOGY AND AI PLATFORM
- DATA-DRIVEN DECISIONS FOR YOUR BUSINESS
- GLOSSARY AND SPECIFIC TERMS
-
2. EXECUTIVE SUMMARY
A Quick Overview of Market Performance
- KEY FINDINGS
- MARKET TRENDS This Chapter is Available Only for the Professional Edition PRO
-
3. MARKET OVERVIEW
Understanding the Current State of The Market and Its Prospects
- MARKET SIZE
- MARKET STRUCTURE
- TRADE BALANCE
- PER CAPITA CONSUMPTION
- MARKET FORECAST TO 2030
-
4. MOST PROMISING PRODUCT
Finding New Products to Diversify Your Business
This Chapter is Available Only for the Professional Edition PRO- TOP PRODUCTS TO DIVERSIFY YOUR BUSINESS
- BEST-SELLING PRODUCTS
- MOST CONSUMED PRODUCT
- MOST TRADED PRODUCT
- MOST PROFITABLE PRODUCT FOR EXPORT
-
5. MOST PROMISING SUPPLYING COUNTRIES
Choosing the Best Countries to Establish Your Sustainable Supply Chain
This Chapter is Available Only for the Professional Edition PRO- TOP COUNTRIES TO SOURCE YOUR PRODUCT
- TOP PRODUCING COUNTRIES
- TOP EXPORTING COUNTRIES
- LOW-COST EXPORTING COUNTRIES
-
6. MOST PROMISING OVERSEAS MARKETS
Choosing the Best Countries to Boost Your Exports
This Chapter is Available Only for the Professional Edition PRO- TOP OVERSEAS MARKETS FOR EXPORTING YOUR PRODUCT
- TOP CONSUMING MARKETS
- UNSATURATED MARKETS
- TOP IMPORTING MARKETS
- MOST PROFITABLE MARKETS
7. PRODUCTION
The Latest Trends and Insights into The Industry
- PRODUCTION VOLUME AND VALUE
8. IMPORTS
The Largest Import Supplying Countries
- IMPORTS FROM 2012–2023
- IMPORTS BY COUNTRY
- IMPORT PRICES BY COUNTRY
9. EXPORTS
The Largest Destinations for Exports
- EXPORTS FROM 2012–2023
- EXPORTS BY COUNTRY
- EXPORT PRICES BY COUNTRY
-
10. PROFILES OF MAJOR PRODUCERS
The Largest Producers on The Market and Their Profiles
This Chapter is Available Only for the Professional Edition PRO -
LIST OF TABLES
- Key Findings In 2023
- Market Volume, In Physical Terms, 2012–2023
- Market Value, 2012–2023
- Per Capita Consumption In 2012-2023
- Imports, In Physical Terms, By Country, 2012–2023
- Imports, In Value Terms, By Country, 2012–2023
- Import Prices, By Country Of Origin, 2012–2023
- Exports, In Physical Terms, By Country, 2012–2023
- Exports, In Value Terms, By Country, 2012–2023
- Export Prices, By Country Of Destination, 2012–2023
-
LIST OF FIGURES
- Market Volume, In Physical Terms, 2012–2023
- Market Value, 2012–2023
- Market Structure – Domestic Supply vs. Imports, In Physical Terms, 2012-2023
- Market Structure – Domestic Supply vs. Imports, In Value Terms, 2012-2023
- Trade Balance, In Physical Terms, 2012-2023
- Trade Balance, In Value Terms, 2012-2023
- Per Capita Consumption, 2012-2023
- Market Volume Forecast to 2030
- Market Value Forecast to 2030
- Products: Market Size And Growth, By Type
- Products: Average Per Capita Consumption, By Type
- Products: Exports And Growth, By Type
- Products: Export Prices And Growth, By Type
- Production Volume And Growth
- Exports And Growth
- Export Prices And Growth
- Market Size And Growth
- Per Capita Consumption
- Imports And Growth
- Import Prices
- Production, In Physical Terms, 2012–2023
- Production, In Value Terms, 2012–2023
- Imports, In Physical Terms, 2012–2023
- Imports, In Value Terms, 2012–2023
- Imports, In Physical Terms, By Country, 2023
- Imports, In Physical Terms, By Country, 2012–2023
- Imports, In Value Terms, By Country, 2012–2023
- Import Prices, By Country Of Origin, 2012–2023
- Exports, In Physical Terms, 2012–2023
- Exports, In Value Terms, 2012–2023
- Exports, In Physical Terms, By Country, 2023
- Exports, In Physical Terms, By Country, 2012–2023
- Exports, In Value Terms, By Country, 2012–2023
- Export Prices, By Country Of Destination, 2012–2023


