U.S. Dental Equipment And Supplies Market. Analysis And Forecast to 2030
Get instant access to more than 2 million reports, dashboards, and datasets on the IndexBox Platform.
View PricingOctober 2023 Sees 19% Surge in Dental Equipment Import Valued at $180M in United States
U.S. Dental Equipment Imports
In October 2023, purchases abroad of dental equipment and supplies decreased by -15.8% to 2.2K tons for the first time since July 2023, thus ending a two-month rising trend. Over the period under review, imports saw a relatively flat trend pattern. The most prominent rate of growth was recorded in May 2023 when imports increased by 43% month-to-month.
In value terms, dental equipment imports soared to $180M (IndexBox estimates) in October 2023. Overall, imports, however, continue to indicate a relatively flat trend pattern. As a result, imports reached the peak and are likely to continue growth in the immediate term.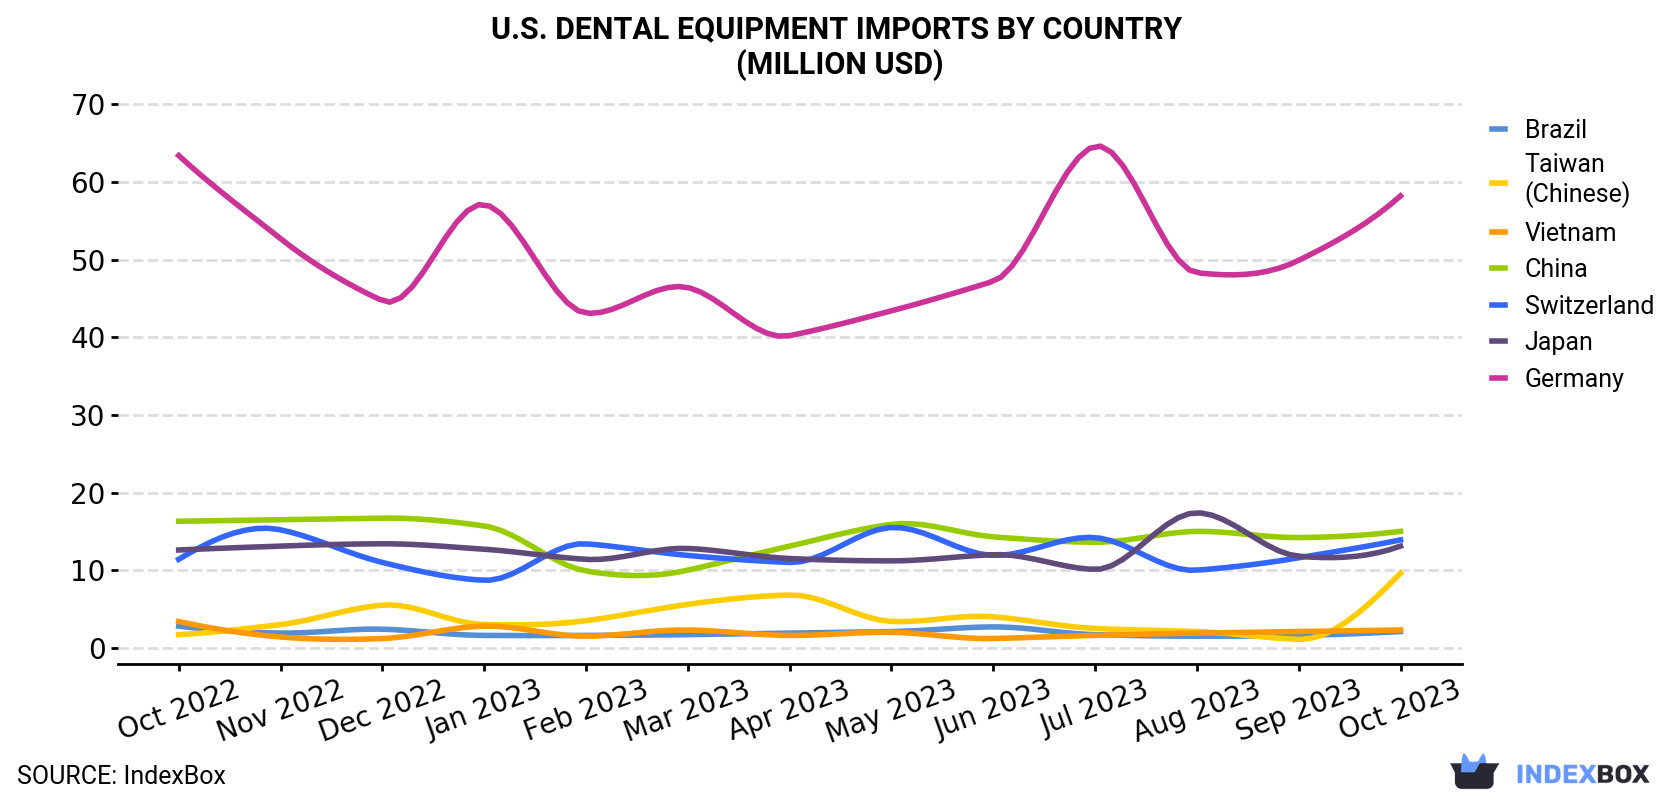
| COUNTRY | Import Value of Dental Equipment in U.S. (million USD) | ||||||||||||
|---|---|---|---|---|---|---|---|---|---|---|---|---|---|
| Oct 2022 | Nov 2022 | Dec 2022 | Jan 2023 | Feb 2023 | Mar 2023 | Apr 2023 | May 2023 | Jun 2023 | Jul 2023 | Aug 2023 | Sep 2023 | Oct 2023 | |
| Germany | 63.4 | 52.7 | 44.7 | 57.1 | 43.1 | 46.4 | 40.2 | 43.4 | 47.2 | 64.6 | 48.3 | 49.9 | 58.2 |
| China | 16.3 | 16.5 | 16.7 | 15.7 | 9.9 | 10.0 | 13.1 | 15.9 | 14.3 | 13.6 | 15.0 | 14.2 | 15.0 |
| Switzerland | 11.4 | 15.2 | 11.0 | 8.7 | 13.4 | 11.9 | 11.0 | 15.5 | 11.9 | 14.2 | 10.0 | 11.6 | 13.9 |
| Japan | 12.6 | 13.1 | 13.4 | 12.7 | 11.4 | 12.8 | 11.5 | 11.2 | 12.0 | 10.1 | 17.4 | 11.8 | 13.1 |
| Taiwan (Chinese) | 1.7 | 3.0 | 5.5 | 3.0 | 3.5 | 5.6 | 6.8 | 3.4 | 4.0 | 2.5 | 2.1 | 1.1 | 9.6 |
| Vietnam | 3.4 | 1.4 | 1.2 | 2.8 | 1.5 | 2.3 | 1.6 | 2.0 | 1.2 | 1.6 | 1.9 | 2.1 | 2.3 |
| Brazil | 2.8 | 1.9 | 2.4 | 1.6 | 1.6 | 1.7 | 1.9 | 2.1 | 2.7 | 1.7 | 1.5 | 1.6 | 2.1 |
| Others | 65.5 | 70.5 | 70.3 | 71.9 | 61.2 | 69.8 | 51.2 | 59.7 | 66.6 | 62.8 | 54.5 | 58.5 | 65.7 |
| Total | 177 | 174 | 165 | 174 | 145 | 160 | 137 | 153 | 160 | 171 | 151 | 151 | 180 |
Imports by Country
In October 2023, China (1.1K tons) constituted the largest dental equipment supplier to the United States, accounting for a 49% share of total imports. Moreover, dental equipment imports from China exceeded the figures recorded by the second-largest supplier, Germany (245 tons), fourfold. Brazil (132 tons) ranked third in terms of total imports with a 6% share.
From October 2022 to October 2023, the average monthly rate of growth in terms of volume from China totaled +1.9%. The remaining supplying countries recorded the following average monthly rates of imports growth: Germany (-1.8% per month) and Brazil (-0.7% per month).
In value terms, Germany ($58M) constituted the largest supplier of dental equipment to the United States, comprising 32% of total imports. The second position in the ranking was held by China ($15M), with an 8.3% share of total imports. It was followed by Switzerland, with a 7.7% share.
From October 2022 to October 2023, the average monthly growth rate of value from Germany was relatively modest. The remaining supplying countries recorded the following average monthly rates of imports growth: China (-0.7% per month) and Switzerland (+1.6% per month).
Import Prices by Country
In October 2023, the dental equipment price stood at $81,547 per ton (CIF, US), increasing by 42% against the previous month. Over the period under review, the import price recorded a relatively flat trend pattern. Over the period under review, average import prices hit record highs at $91,389 per ton in July 2023; however, from August 2023 to October 2023, import prices remained at a lower figure.
There were significant differences in the average prices amongst the major supplying countries. In October 2023, the country with the highest price was Germany ($237K per ton), while the price for China ($13,706 per ton) was amongst the lowest.
From October 2022 to October 2023, the most notable rate of growth in terms of prices was attained by Taiwan (Chinese) (+21.8%), while the prices for the other major suppliers experienced more modest paces of growth.
This report provides an in-depth analysis of the dental equipment market in the U.S.. Within it, you will discover the latest data on market trends and opportunities by country, consumption, production and price developments, as well as the global trade (imports and exports). The forecast exhibits the market prospects through 2030.
Product coverage:
- NAICS 339114 - Dental equipment and supplies manufacturing
Companies mentioned:
- Dentsply International Inc.
- Nobel Biocare Usa
- A-Dec
- Align Technology
- Ultradent Products
- Biolase
- Hu-Friedy Mfg. Co.
- Coltene/Whaledent
- Biomet 3i
- American Orthodontics Corp
- Gc America Inc.
- Sybron Dental Specialties
- Jensen Industries Inc.
- TP Orthodontics
- Ranir
- The Pelton & Crane Company
- Tulsa Dental Products
- Philips Oral Healthcare
- Ortho Organizers
- Crosstex International
- Tidi Products
- 3M Unitek Corporation
- Hiossen
- Rmo, Pro-Lyco
- Heraeus Kulzer
- Dental Equipment
- Young Innovations
- Ormco Corporation
- CP Dental
- Young Innovations Holdings
Country coverage:
- United States
Data coverage:
- Market volume and value
- Per Capita consumption
- Forecast of the market dynamics in the medium term
- Trade (exports and imports) in the U.S.
- Export and import prices
- Market trends, drivers and restraints
- Key market players and their profiles
Reasons to buy this report:
- Take advantage of the latest data
- Find deeper insights into current market developments
- Discover vital success factors affecting the market
This report is designed for manufacturers, distributors, importers, and wholesalers, as well as for investors, consultants and advisors.
In this report, you can find information that helps you to make informed decisions on the following issues:
- How to diversify your business and benefit from new market opportunities
- How to load your idle production capacity
- How to boost your sales on overseas markets
- How to increase your profit margins
- How to make your supply chain more sustainable
- How to reduce your production and supply chain costs
- How to outsource production to other countries
- How to prepare your business for global expansion
While doing this research, we combine the accumulated expertise of our analysts and the capabilities of artificial intelligence. The AI-based platform, developed by our data scientists, constitutes the key working tool for business analysts, empowering them to discover deep insights and ideas from the marketing data.
-
1. INTRODUCTION
Making Data-Driven Decisions to Grow Your Business
- REPORT DESCRIPTION
- RESEARCH METHODOLOGY AND AI PLATFORM
- DATA-DRIVEN DECISIONS FOR YOUR BUSINESS
- GLOSSARY AND SPECIFIC TERMS
-
2. EXECUTIVE SUMMARY
A Quick Overview of Market Performance
- KEY FINDINGS
- MARKET TRENDS This Chapter is Available Only for the Professional Edition PRO
-
3. MARKET OVERVIEW
Understanding the Current State of The Market and Its Prospects
- MARKET SIZE
- MARKET STRUCTURE
- TRADE BALANCE
- PER CAPITA CONSUMPTION
- MARKET FORECAST TO 2030
-
4. MOST PROMISING PRODUCT
Finding New Products to Diversify Your Business
This Chapter is Available Only for the Professional Edition PRO- TOP PRODUCTS TO DIVERSIFY YOUR BUSINESS
- BEST-SELLING PRODUCTS
- MOST CONSUMED PRODUCT
- MOST TRADED PRODUCT
- MOST PROFITABLE PRODUCT FOR EXPORT
-
5. MOST PROMISING SUPPLYING COUNTRIES
Choosing the Best Countries to Establish Your Sustainable Supply Chain
This Chapter is Available Only for the Professional Edition PRO- TOP COUNTRIES TO SOURCE YOUR PRODUCT
- TOP PRODUCING COUNTRIES
- TOP EXPORTING COUNTRIES
- LOW-COST EXPORTING COUNTRIES
-
6. MOST PROMISING OVERSEAS MARKETS
Choosing the Best Countries to Boost Your Exports
This Chapter is Available Only for the Professional Edition PRO- TOP OVERSEAS MARKETS FOR EXPORTING YOUR PRODUCT
- TOP CONSUMING MARKETS
- UNSATURATED MARKETS
- TOP IMPORTING MARKETS
- MOST PROFITABLE MARKETS
7. PRODUCTION
The Latest Trends and Insights into The Industry
- PRODUCTION VOLUME AND VALUE
8. IMPORTS
The Largest Import Supplying Countries
- IMPORTS FROM 2012–2023
- IMPORTS BY COUNTRY
- IMPORT PRICES BY COUNTRY
9. EXPORTS
The Largest Destinations for Exports
- EXPORTS FROM 2012–2023
- EXPORTS BY COUNTRY
- EXPORT PRICES BY COUNTRY
-
10. PROFILES OF MAJOR PRODUCERS
The Largest Producers on The Market and Their Profiles
This Chapter is Available Only for the Professional Edition PRO -
LIST OF TABLES
- Key Findings In 2023
- Market Volume, In Physical Terms, 2012–2023
- Market Value, 2012–2023
- Per Capita Consumption In 2012-2023
- Imports, In Physical Terms, By Country, 2012–2023
- Imports, In Value Terms, By Country, 2012–2023
- Import Prices, By Country Of Origin, 2012–2023
- Exports, In Physical Terms, By Country, 2012–2023
- Exports, In Value Terms, By Country, 2012–2023
- Export Prices, By Country Of Destination, 2012–2023
-
LIST OF FIGURES
- Market Volume, In Physical Terms, 2012–2023
- Market Value, 2012–2023
- Market Structure – Domestic Supply vs. Imports, In Physical Terms, 2012-2023
- Market Structure – Domestic Supply vs. Imports, In Value Terms, 2012-2023
- Trade Balance, In Physical Terms, 2012-2023
- Trade Balance, In Value Terms, 2012-2023
- Per Capita Consumption, 2012-2023
- Market Volume Forecast to 2030
- Market Value Forecast to 2030
- Products: Market Size And Growth, By Type
- Products: Average Per Capita Consumption, By Type
- Products: Exports And Growth, By Type
- Products: Export Prices And Growth, By Type
- Production Volume And Growth
- Exports And Growth
- Export Prices And Growth
- Market Size And Growth
- Per Capita Consumption
- Imports And Growth
- Import Prices
- Production, In Physical Terms, 2012–2023
- Production, In Value Terms, 2012–2023
- Imports, In Physical Terms, 2012–2023
- Imports, In Value Terms, 2012–2023
- Imports, In Physical Terms, By Country, 2023
- Imports, In Physical Terms, By Country, 2012–2023
- Imports, In Value Terms, By Country, 2012–2023
- Import Prices, By Country Of Origin, 2012–2023
- Exports, In Physical Terms, 2012–2023
- Exports, In Value Terms, 2012–2023
- Exports, In Physical Terms, By Country, 2023
- Exports, In Physical Terms, By Country, 2012–2023
- Exports, In Value Terms, By Country, 2012–2023
- Export Prices, By Country Of Destination, 2012–2023


