U.S. - Ethyl Alcohol - Market Analysis, Forecast, Size, Trends and Insights
Get instant access to more than 2 million reports, dashboards, and datasets on the IndexBox Platform.
View PricingDecember 2023 Sets New Record As U.S. Ethanol Exports Skyrocket to $589M, Surging by 11%
U.S. Ethanol Exports
In December 2023, after two months of decline, there was significant growth in overseas shipments of ethyl alcohol, when their volume increased by 30% to 954M litres. The total export volume increased at an average monthly rate of +5.6% from December 2022 to December 2023; however, the trend pattern indicated some noticeable fluctuations being recorded throughout the analyzed period. The pace of growth appeared the most rapid in January 2023 when exports increased by 61% against the previous month. Over the period under review, the exports reached the peak figure in December 2023.
In value terms, ethanol exports expanded notably to $589M (IndexBox estimates) in December 2023. The total export value increased at an average monthly rate of +3.6% over the period from December 2022 to December 2023; however, the trend pattern remained relatively stable, with somewhat noticeable fluctuations in certain months. The growth pace was the most rapid in January 2023 when exports increased by 46% against the previous month. The exports peaked in December 2023.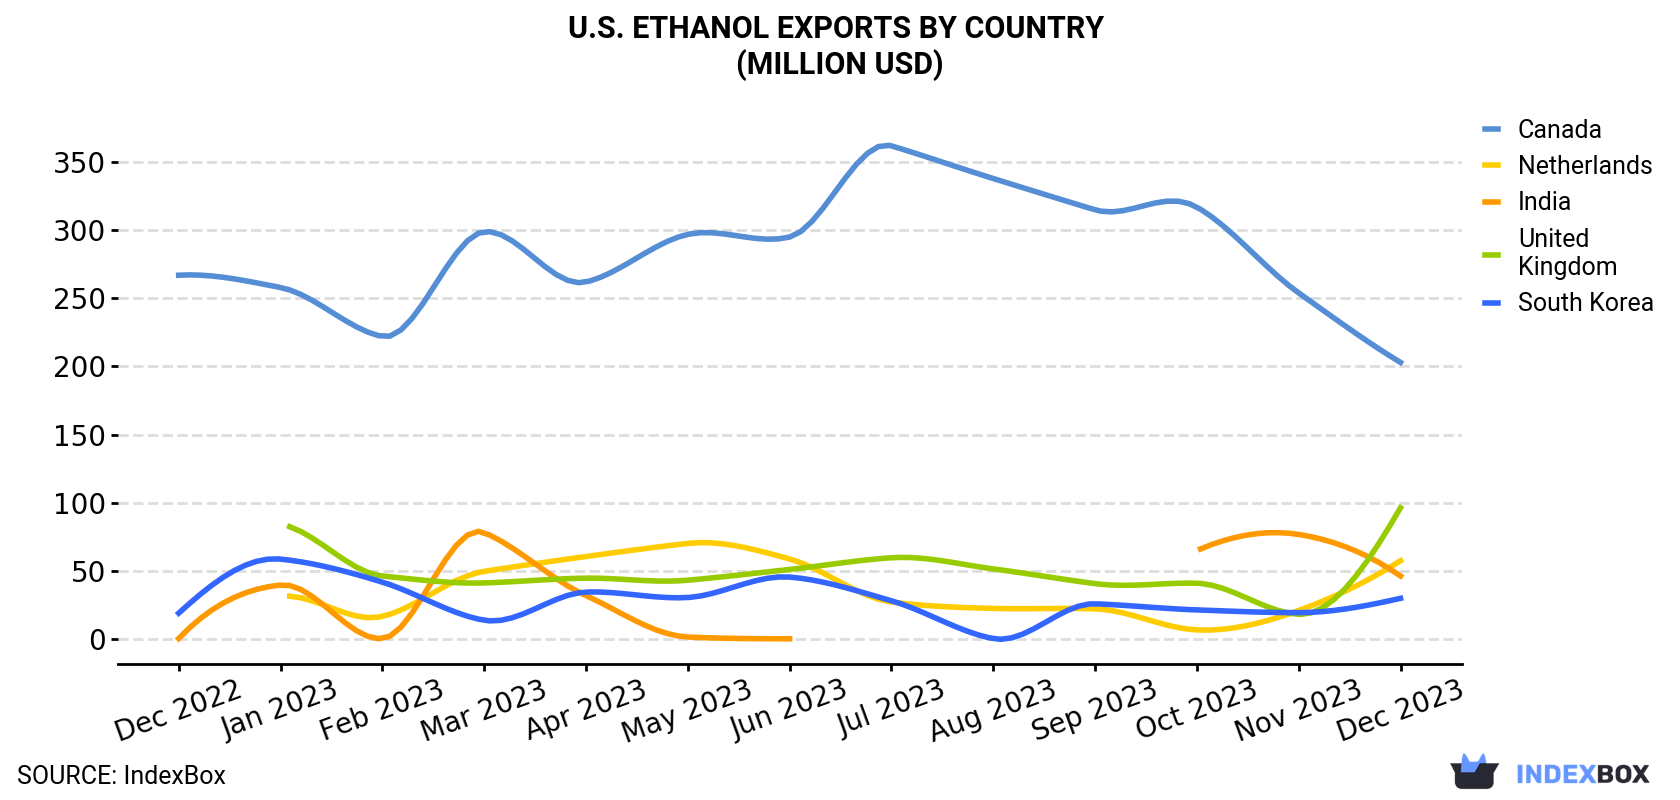
| COUNTRY | Export Value of Ethanol in U.S. (million USD) | ||||||||||||
|---|---|---|---|---|---|---|---|---|---|---|---|---|---|
| Dec 2022 | Jan 2023 | Feb 2023 | Mar 2023 | Apr 2023 | May 2023 | Jun 2023 | Jul 2023 | Aug 2023 | Sep 2023 | Oct 2023 | Nov 2023 | Dec 2023 | |
| Canada | 267 | 258 | 222 | 299 | 262 | 297 | 295 | 362 | 338 | 315 | 317 | 254 | 203 |
| United Kingdom | < 0.1 | 84.1 | 46.2 | 41.1 | 44.6 | 43.1 | 51.0 | 59.6 | 51.4 | 40.6 | 40.9 | 18.0 | 96.3 |
| Netherlands | < 0.1 | 31.2 | 16.5 | 49.6 | 60.5 | 70.1 | 58.7 | 27.1 | 22.4 | 22.1 | 6.6 | 20.9 | 57.4 |
| India | 0.3 | 39.6 | 0.2 | 78.1 | 31.8 | 1.4 | 0.1 | < 0.1 | < 0.1 | < 0.1 | 64.9 | 76.7 | 46.2 |
| South Korea | 18.9 | 58.6 | 41.7 | 13.7 | 34.4 | 30.4 | 45.4 | 28.0 | 0.2 | 25.8 | 21.3 | 19.3 | 29.8 |
| Others | 101 | 92.1 | 165 | 86.0 | 87.8 | 82.6 | 97.2 | 65.0 | 87.7 | 158 | 75.4 | 142 | 156 |
| Total | 387 | 564 | 492 | 568 | 521 | 525 | 548 | 542 | 500 | 561 | 526 | 531 | 589 |
Exports by Country
Canada (327M litres) was the main destination for ethanol exports from the United States, with a 34% share of total exports. Moreover, ethanol exports to Canada exceeded the volume sent to the second major destination, the UK (153M litres), twofold. The third position in this ranking was taken by the Netherlands (93M litres), with a 9.7% share.
From December 2022 to December 2023, the average monthly growth rate of volume to Canada was relatively modest. Exports to the other major destinations recorded the following average monthly rates of exports growth: the UK (+147.2% per month) and the Netherlands (+118.0% per month).
In value terms, Canada ($203M) remains the key foreign market for ethanol exports from the United States, comprising 34% of total exports. The second position in the ranking was taken by the UK ($96M), with a 16% share of total exports. It was followed by the Netherlands, with a 9.7% share.
From December 2022 to December 2023, the average monthly growth rate of value to Canada totaled -2.3%. Exports to the other major destinations recorded the following average monthly rates of exports growth: the UK (+101.6% per month) and the Netherlands (+97.0% per month).
Exports by Type
Undenatured ethyl alcohol of an alcoholic strength by volume more than 80 % (609M litres) and denatured ethyl alcohol and other denatured spirits (346M litres) were the main products of ethanol exports from the United States.
From December 2022 to December 2023, the biggest increases were in undenatured ethyl alcohol (with a CAGR of +6.1%).
In value terms, the most traded types of ethyl alcohol in the United States were undenatured ethyl alcohol of an alcoholic strength by volume more than 80 % ($378M) and denatured ethyl alcohol and other denatured spirits ($211M).
Among the main product categories, undenatured ethyl alcohol, with a CAGR of +3.7%, saw the highest rates of growth with regard to the value of exports, over the period under review.
Export Prices by Country
In December 2023, the ethanol price stood at $617 per thousand litres (FOB, US), declining by -14.6% against the previous month. In general, the export price recorded a noticeable setback. The most prominent rate of growth was recorded in November 2023 when the average export price increased by 8.7% against the previous month. Over the period under review, the average export prices hit record highs at $781 per thousand litres in December 2022; however, from January 2023 to December 2023, the export prices failed to regain momentum.
There were significant differences in the average prices for the major export markets. In December 2023, the country with the highest price was Peru ($755 per thousand litres), while the average price for exports to the United Arab Emirates ($481 per thousand litres) was amongst the lowest.
From December 2022 to December 2023, the most notable rate of growth in terms of prices was recorded for supplies to South Korea (+1.1%), while the prices for the other major destinations experienced a decline.
This report provides an in-depth analysis of the ethanol market in the U.S.. Within it, you will discover the latest data on market trends and opportunities by country, consumption, production and price developments, as well as the global trade (imports and exports). The forecast exhibits the market prospects through 2030.
Product coverage:
- Prodcom 20147400 - Undenatured ethyl alcohol of an alcoholic strength by volume. .80 % (important: excluding alcohol duty)
- Prodcom 20147500 - Denatured ethyl alcohol and other denatured spirits, of any strength
Country coverage:
- United States
Data coverage:
- Market volume and value
- Per Capita consumption
- Forecast of the market dynamics in the medium term
- Trade (exports and imports) in the U.S.
- Export and import prices
- Market trends, drivers and restraints
- Key market players and their profiles
Reasons to buy this report:
- Take advantage of the latest data
- Find deeper insights into current market developments
- Discover vital success factors affecting the market
This report is designed for manufacturers, distributors, importers, and wholesalers, as well as for investors, consultants and advisors.
In this report, you can find information that helps you to make informed decisions on the following issues:
- How to diversify your business and benefit from new market opportunities
- How to load your idle production capacity
- How to boost your sales on overseas markets
- How to increase your profit margins
- How to make your supply chain more sustainable
- How to reduce your production and supply chain costs
- How to outsource production to other countries
- How to prepare your business for global expansion
While doing this research, we combine the accumulated expertise of our analysts and the capabilities of artificial intelligence. The AI-based platform, developed by our data scientists, constitutes the key working tool for business analysts, empowering them to discover deep insights and ideas from the marketing data.
-
1. INTRODUCTION
Making Data-Driven Decisions to Grow Your Business
- REPORT DESCRIPTION
- RESEARCH METHODOLOGY AND AI PLATFORM
- DATA-DRIVEN DECISIONS FOR YOUR BUSINESS
- GLOSSARY AND SPECIFIC TERMS
-
2. EXECUTIVE SUMMARY
A Quick Overview of Market Performance
- KEY FINDINGS
- MARKET TRENDS This Chapter is Available Only for the Professional Edition PRO
-
3. MARKET OVERVIEW
Understanding the Current State of The Market and Its Prospects
- MARKET SIZE
- MARKET STRUCTURE
- TRADE BALANCE
- PER CAPITA CONSUMPTION
- MARKET FORECAST TO 2030
-
4. MOST PROMISING PRODUCT
Finding New Products to Diversify Your Business
This Chapter is Available Only for the Professional Edition PRO- TOP PRODUCTS TO DIVERSIFY YOUR BUSINESS
- BEST-SELLING PRODUCTS
- MOST CONSUMED PRODUCT
- MOST TRADED PRODUCT
- MOST PROFITABLE PRODUCT FOR EXPORT
-
5. MOST PROMISING SUPPLYING COUNTRIES
Choosing the Best Countries to Establish Your Sustainable Supply Chain
This Chapter is Available Only for the Professional Edition PRO- TOP COUNTRIES TO SOURCE YOUR PRODUCT
- TOP PRODUCING COUNTRIES
- TOP EXPORTING COUNTRIES
- LOW-COST EXPORTING COUNTRIES
-
6. MOST PROMISING OVERSEAS MARKETS
Choosing the Best Countries to Boost Your Exports
This Chapter is Available Only for the Professional Edition PRO- TOP OVERSEAS MARKETS FOR EXPORTING YOUR PRODUCT
- TOP CONSUMING MARKETS
- UNSATURATED MARKETS
- TOP IMPORTING MARKETS
- MOST PROFITABLE MARKETS
7. PRODUCTION
The Latest Trends and Insights into The Industry
- PRODUCTION VOLUME AND VALUE
8. IMPORTS
The Largest Import Supplying Countries
- IMPORTS FROM 2012–2023
- IMPORTS BY COUNTRY
- IMPORT PRICES BY COUNTRY
9. EXPORTS
The Largest Destinations for Exports
- EXPORTS FROM 2012–2023
- EXPORTS BY COUNTRY
- EXPORT PRICES BY COUNTRY
-
10. PROFILES OF MAJOR PRODUCERS
The Largest Producers on The Market and Their Profiles
This Chapter is Available Only for the Professional Edition PRO -
LIST OF TABLES
- Key Findings In 2023
- Market Volume, In Physical Terms, 2012–2023
- Market Value, 2012–2023
- Per Capita Consumption In 2012-2023
- Imports, In Physical Terms, By Country, 2012–2023
- Imports, In Value Terms, By Country, 2012–2023
- Import Prices, By Country Of Origin, 2012–2023
- Exports, In Physical Terms, By Country, 2012–2023
- Exports, In Value Terms, By Country, 2012–2023
- Export Prices, By Country Of Destination, 2012–2023
-
LIST OF FIGURES
- Market Volume, In Physical Terms, 2012–2023
- Market Value, 2012–2023
- Market Structure – Domestic Supply vs. Imports, In Physical Terms, 2012-2023
- Market Structure – Domestic Supply vs. Imports, In Value Terms, 2012-2023
- Trade Balance, In Physical Terms, 2012-2023
- Trade Balance, In Value Terms, 2012-2023
- Per Capita Consumption, 2012-2023
- Market Volume Forecast to 2030
- Market Value Forecast to 2030
- Products: Market Size And Growth, By Type
- Products: Average Per Capita Consumption, By Type
- Products: Exports And Growth, By Type
- Products: Export Prices And Growth, By Type
- Production Volume And Growth
- Exports And Growth
- Export Prices And Growth
- Market Size And Growth
- Per Capita Consumption
- Imports And Growth
- Import Prices
- Production, In Physical Terms, 2012–2023
- Production, In Value Terms, 2012–2023
- Imports, In Physical Terms, 2012–2023
- Imports, In Value Terms, 2012–2023
- Imports, In Physical Terms, By Country, 2023
- Imports, In Physical Terms, By Country, 2012–2023
- Imports, In Value Terms, By Country, 2012–2023
- Import Prices, By Country Of Origin, 2012–2023
- Exports, In Physical Terms, 2012–2023
- Exports, In Value Terms, 2012–2023
- Exports, In Physical Terms, By Country, 2023
- Exports, In Physical Terms, By Country, 2012–2023
- Exports, In Value Terms, By Country, 2012–2023
- Export Prices, By Country Of Destination, 2012–2023


