
Spain - Butter And Ghee - Market Analysis, Forecast, Size, Trends and Insights
Get instant access to more than 2 million reports, dashboards, and datasets on the IndexBox Platform.
View PricingAugust 2023 Sees a Decline in Spain's Import of Butter and Ghee, Totaling $17M.
Spain Butter And Ghee Imports
In August 2023, overseas purchases of butter and ghee decreased by -1.8% to 2.8K tons, falling for the second consecutive month after two months of growth. Overall, imports recorded a perceptible shrinkage. The pace of growth appeared the most rapid in November 2022 when imports increased by 34% month-to-month.
In value terms, butter and ghee imports shrank slightly to $17M (IndexBox estimates) in August 2023. In general, imports showed a relatively flat trend pattern. The pace of growth was the most pronounced in November 2022 with an increase of 41% against the previous month.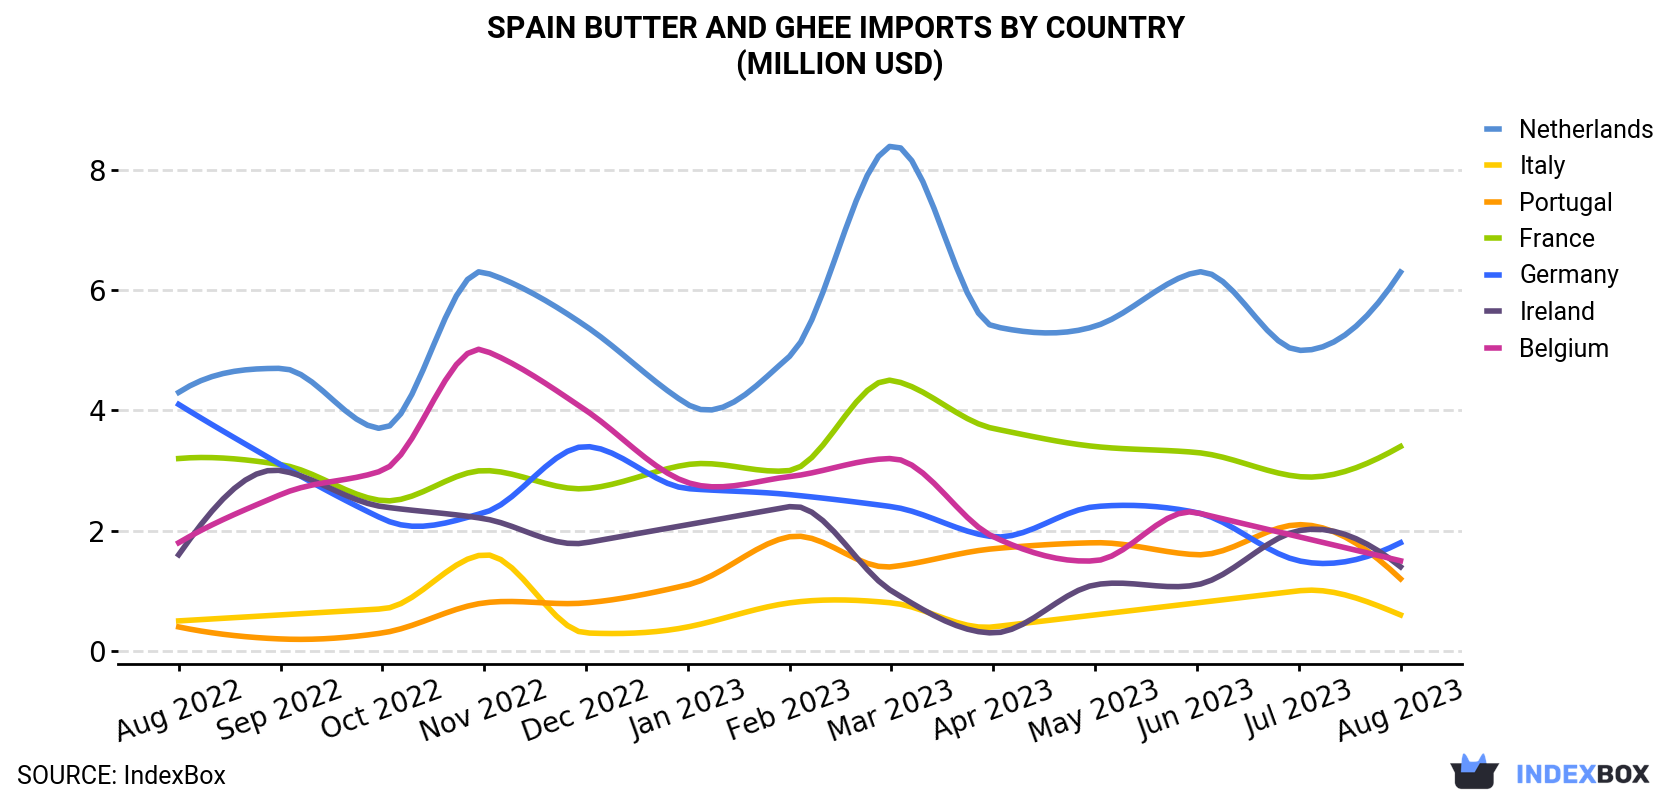
| COUNTRY | Import Value of Butter And Ghee in Spain (million USD) | ||||||||||||
|---|---|---|---|---|---|---|---|---|---|---|---|---|---|
| Aug 2022 | Sep 2022 | Oct 2022 | Nov 2022 | Dec 2022 | Jan 2023 | Feb 2023 | Mar 2023 | Apr 2023 | May 2023 | Jun 2023 | Jul 2023 | Aug 2023 | |
| Netherlands | 4.3 | 4.7 | 3.7 | 6.3 | 5.4 | 4.1 | 4.9 | 8.4 | 5.4 | 5.4 | 6.3 | 5.0 | 6.3 |
| France | 3.2 | 3.1 | 2.5 | 3.0 | 2.7 | 3.1 | 3.0 | 4.5 | 3.7 | 3.4 | 3.3 | 2.9 | 3.4 |
| Germany | 4.1 | 3.1 | 2.2 | 2.3 | 3.4 | 2.7 | 2.6 | 2.4 | 1.9 | 2.4 | 2.3 | 1.5 | 1.8 |
| Belgium | 1.8 | 2.6 | 3.0 | 5.0 | 4.0 | 2.8 | 2.9 | 3.2 | 1.9 | 1.5 | 2.3 | 1.9 | 1.5 |
| Ireland | 1.6 | 3.0 | 2.4 | 2.2 | 1.8 | 2.1 | 2.4 | 1.0 | 0.3 | 1.1 | 1.1 | 2.0 | 1.4 |
| Portugal | 0.4 | 0.2 | 0.3 | 0.8 | 0.8 | 1.1 | 1.9 | 1.4 | 1.7 | 1.8 | 1.6 | 2.1 | 1.2 |
| Italy | 0.5 | 0.6 | 0.7 | 1.6 | 0.3 | 0.4 | 0.8 | 0.8 | 0.4 | 0.6 | 0.8 | 1.0 | 0.6 |
| Others | 1.2 | 0.7 | 0.5 | 0.5 | 0.4 | 0.3 | 1.0 | 1.1 | 0.5 | 1.7 | 0.8 | 0.8 | 0.7 |
| Total | 17.1 | 18.1 | 15.3 | 21.6 | 18.8 | 16.7 | 19.6 | 22.8 | 15.9 | 18.0 | 18.5 | 17.2 | 16.9 |
Imports by Country
In August 2023, the Netherlands (1K tons) constituted the largest butter and ghee supplier to Spain, with a 37% share of total imports. Moreover, butter and ghee imports from the Netherlands exceeded the figures recorded by the second-largest supplier, France (499 tons), twofold. The third position in this ranking was taken by Germany (302 tons), with an 11% share.
From August 2022 to August 2023, the average monthly rate of growth in terms of volume from the Netherlands amounted to +3.2%. The remaining supplying countries recorded the following average monthly rates of imports growth: France (+0.8% per month) and Germany (-15.6% per month).
In value terms, the largest butter and ghee suppliers to Spain were the Netherlands ($6.3M), France ($3.4M) and Germany ($1.8M), with a combined 68% share of total imports. Belgium, Ireland, Portugal and Italy lagged somewhat behind, together comprising a further 28%.
Among the main suppliers, Portugal, with a CAGR of +11.0%, saw the highest rates of growth with regard to the value of imports, over the period under review, while purchases for the other leaders experienced more modest paces of growth.
Imports by Type
In August 2023, butter and dairy spreads (2.6K tons) was the main type of butter and ghee supplied to Spain, with a 94% share of total imports. Moreover, butter and dairy spreads exceeded the figures recorded for the second-largest type, ghee (155 tons), more than tenfold.
From August 2022 to August 2023, the average monthly rate of growth in terms of the volume of import of butter and dairy spreads stood at -3.8%.
In value terms, butter and dairy spreads ($16M) constituted the largest type of butter and ghee supplied to Spain, comprising 94% of total imports. The second position in the ranking was taken by ghee ($1.1M), with a 6.5% share of total imports.
Import Prices by Country
In August 2023, the butter and ghee price stood at $6,126 per ton (CIF, Spain), approximately reflecting the previous month. Over the last twelve-month period, it increased at an average monthly rate of +3.7%. The pace of growth appeared the most rapid in October 2022 an increase of 33% month-to-month. Over the period under review, average import prices reached the maximum at $7,348 per ton in December 2022; however, from January 2023 to August 2023, import prices stood at a somewhat lower figure.
Average prices varied noticeably amongst the major supplying countries. In August 2023, the countries with the highest prices were France ($6,733 per ton) and Portugal ($6,458 per ton), while the price for Ireland ($5,472 per ton) and Belgium ($5,808 per ton) were amongst the lowest.
From August 2022 to August 2023, the most notable rate of growth in terms of prices was attained by Germany (+10.5%), while the prices for the other major suppliers experienced a decline.
This report provides an in-depth analysis of the butter and ghee market in Spain. Within it, you will discover the latest data on market trends and opportunities by country, consumption, production and price developments, as well as the global trade (imports and exports). The forecast exhibits the market prospects through 2030.
Product coverage:
- FCL 983 - Butter and Ghee of Sheep Milk
- FCL 1022 - Butter of Goat Milk
- FCL 952 - Butter of Buffalo Milk
- FCL 886 - Butter of Cow Milk
- FCL 887 - Ghee from Cow Milk
- FCL 953 - Ghee, from Buffalo Milk
Country coverage:
- Spain
Data coverage:
- Market volume and value
- Per Capita consumption
- Forecast of the market dynamics in the medium term
- Trade (exports and imports) in Spain
- Export and import prices
- Market trends, drivers and restraints
- Key market players and their profiles
Reasons to buy this report:
- Take advantage of the latest data
- Find deeper insights into current market developments
- Discover vital success factors affecting the market
This report is designed for manufacturers, distributors, importers, and wholesalers, as well as for investors, consultants and advisors.
In this report, you can find information that helps you to make informed decisions on the following issues:
- How to diversify your business and benefit from new market opportunities
- How to load your idle production capacity
- How to boost your sales on overseas markets
- How to increase your profit margins
- How to make your supply chain more sustainable
- How to reduce your production and supply chain costs
- How to outsource production to other countries
- How to prepare your business for global expansion
While doing this research, we combine the accumulated expertise of our analysts and the capabilities of artificial intelligence. The AI-based platform, developed by our data scientists, constitutes the key working tool for business analysts, empowering them to discover deep insights and ideas from the marketing data.
-
1. INTRODUCTION
Making Data-Driven Decisions to Grow Your Business
- REPORT DESCRIPTION
- RESEARCH METHODOLOGY AND AI PLATFORM
- DATA-DRIVEN DECISIONS FOR YOUR BUSINESS
- GLOSSARY AND SPECIFIC TERMS
-
2. EXECUTIVE SUMMARY
A Quick Overview of Market Performance
- KEY FINDINGS
- MARKET TRENDS This Chapter is Available Only for the Professional Edition PRO
-
3. MARKET OVERVIEW
Understanding the Current State of The Market and Its Prospects
- MARKET SIZE
- MARKET STRUCTURE
- TRADE BALANCE
- PER CAPITA CONSUMPTION
- MARKET FORECAST TO 2030
-
4. MOST PROMISING PRODUCT
Finding New Products to Diversify Your Business
This Chapter is Available Only for the Professional Edition PRO- TOP PRODUCTS TO DIVERSIFY YOUR BUSINESS
- BEST-SELLING PRODUCTS
- MOST CONSUMED PRODUCT
- MOST TRADED PRODUCT
- MOST PROFITABLE PRODUCT FOR EXPORT
-
5. MOST PROMISING SUPPLYING COUNTRIES
Choosing the Best Countries to Establish Your Sustainable Supply Chain
This Chapter is Available Only for the Professional Edition PRO- TOP COUNTRIES TO SOURCE YOUR PRODUCT
- TOP PRODUCING COUNTRIES
- TOP EXPORTING COUNTRIES
- LOW-COST EXPORTING COUNTRIES
-
6. MOST PROMISING OVERSEAS MARKETS
Choosing the Best Countries to Boost Your Exports
This Chapter is Available Only for the Professional Edition PRO- TOP OVERSEAS MARKETS FOR EXPORTING YOUR PRODUCT
- TOP CONSUMING MARKETS
- UNSATURATED MARKETS
- TOP IMPORTING MARKETS
- MOST PROFITABLE MARKETS
7. PRODUCTION
The Latest Trends and Insights into The Industry
- PRODUCTION VOLUME AND VALUE
8. IMPORTS
The Largest Import Supplying Countries
- IMPORTS FROM 2012–2023
- IMPORTS BY COUNTRY
- IMPORT PRICES BY COUNTRY
9. EXPORTS
The Largest Destinations for Exports
- EXPORTS FROM 2012–2023
- EXPORTS BY COUNTRY
- EXPORT PRICES BY COUNTRY
-
10. PROFILES OF MAJOR PRODUCERS
The Largest Producers on The Market and Their Profiles
This Chapter is Available Only for the Professional Edition PRO -
LIST OF TABLES
- Key Findings In 2023
- Market Volume, In Physical Terms, 2012–2023
- Market Value, 2012–2023
- Per Capita Consumption In 2012-2023
- Imports, In Physical Terms, By Country, 2012–2023
- Imports, In Value Terms, By Country, 2012–2023
- Import Prices, By Country Of Origin, 2012–2023
- Exports, In Physical Terms, By Country, 2012–2023
- Exports, In Value Terms, By Country, 2012–2023
- Export Prices, By Country Of Destination, 2012–2023
-
LIST OF FIGURES
- Market Volume, In Physical Terms, 2012–2023
- Market Value, 2012–2023
- Market Structure – Domestic Supply vs. Imports, In Physical Terms, 2012-2023
- Market Structure – Domestic Supply vs. Imports, In Value Terms, 2012-2023
- Trade Balance, In Physical Terms, 2012-2023
- Trade Balance, In Value Terms, 2012-2023
- Per Capita Consumption, 2012-2023
- Market Volume Forecast to 2030
- Market Value Forecast to 2030
- Products: Market Size And Growth, By Type
- Products: Average Per Capita Consumption, By Type
- Products: Exports And Growth, By Type
- Products: Export Prices And Growth, By Type
- Production Volume And Growth
- Exports And Growth
- Export Prices And Growth
- Market Size And Growth
- Per Capita Consumption
- Imports And Growth
- Import Prices
- Production, In Physical Terms, 2012–2023
- Production, In Value Terms, 2012–2023
- Imports, In Physical Terms, 2012–2023
- Imports, In Value Terms, 2012–2023
- Imports, In Physical Terms, By Country, 2023
- Imports, In Physical Terms, By Country, 2012–2023
- Imports, In Value Terms, By Country, 2012–2023
- Import Prices, By Country Of Origin, 2012–2023
- Exports, In Physical Terms, 2012–2023
- Exports, In Value Terms, 2012–2023
- Exports, In Physical Terms, By Country, 2023
- Exports, In Physical Terms, By Country, 2012–2023
- Exports, In Value Terms, By Country, 2012–2023
- Export Prices, By Country Of Destination, 2012–2023


