Brazil - Oil Crops - Market Analysis, Forecast, Size, Trends and Insights
Get instant access to more than 2 million reports, dashboards, and datasets on the IndexBox Platform.
View PricingBrazil's Exports of Oil Crops Dive to $1.5B in January 2024
Brazil Oil Crops Exports
In January 2024, shipments abroad of oil crops (primary) decreased by -24.8% to 2.9M tons, falling for the eighth consecutive month after five months of growth. Overall, exports, however, showed a strong increase. The most prominent rate of growth was recorded in February 2023 with an increase of 478% month-to-month.
In value terms, oil crops exports fell markedly to $1.5B (IndexBox estimates) in January 2024. In general, exports, however, enjoyed a remarkable increase. The growth pace was the most rapid in February 2023 when exports increased by 423% against the previous month.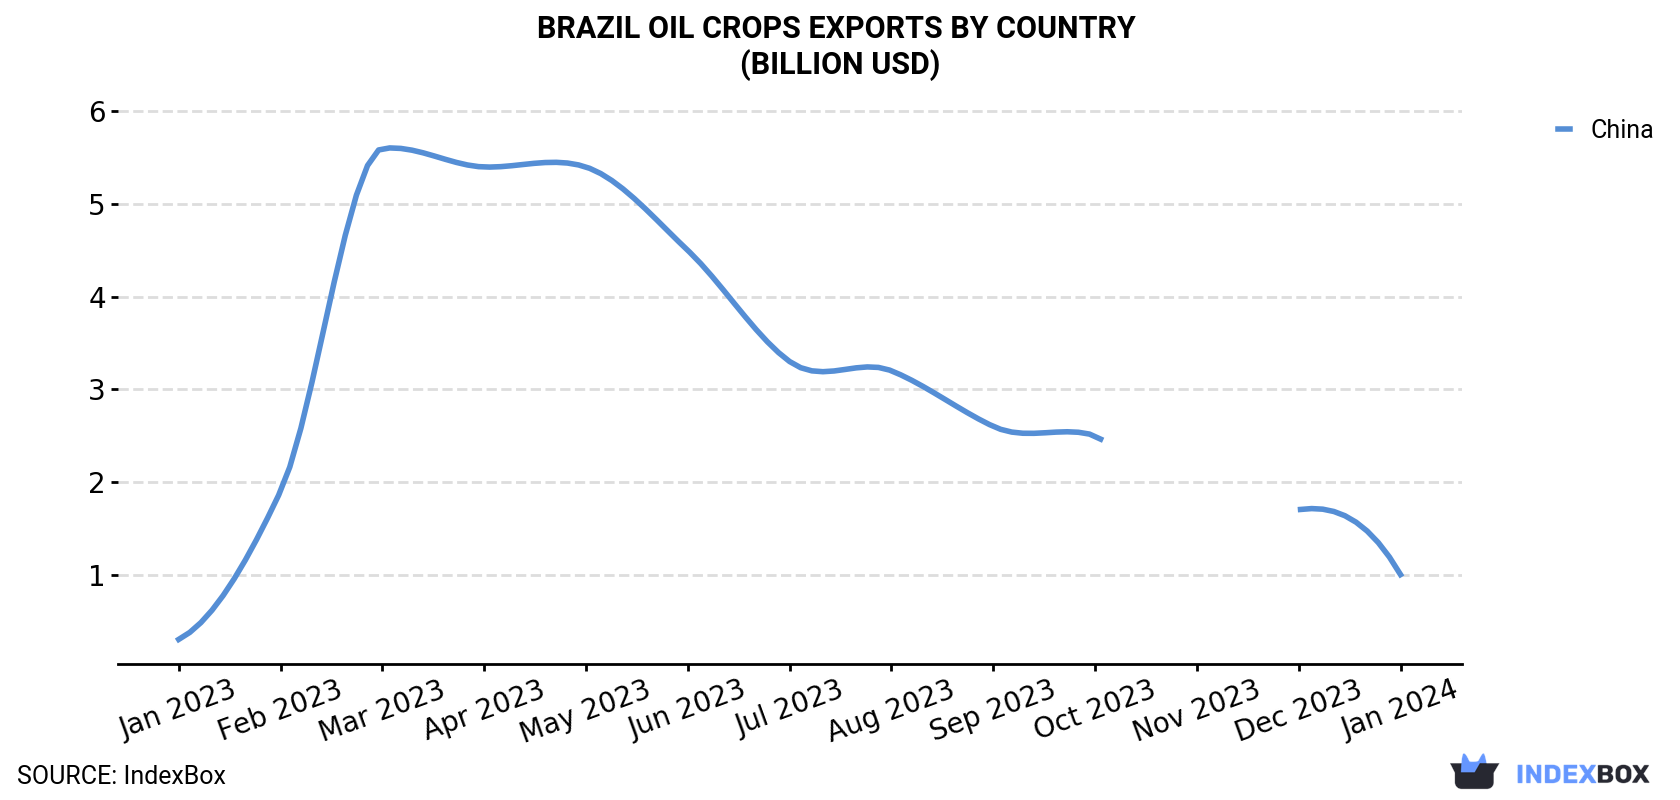
| COUNTRY | Export Value of Oil Crops in Brazil (billion USD) | ||||||||||||
|---|---|---|---|---|---|---|---|---|---|---|---|---|---|
| Jan 2023 | Feb 2023 | Mar 2023 | Apr 2023 | May 2023 | Jun 2023 | Jul 2023 | Aug 2023 | Sep 2023 | Oct 2023 | Nov 2023 | Dec 2023 | Jan 2024 | |
| China | 0.3 | 1.9 | 5.6 | 5.4 | 5.4 | 4.5 | 3.3 | 3.2 | 2.6 | 2.5 | < 0.1 | 1.7 | 1.0 |
| Others | 0.2 | 0.9 | 1.8 | 2.3 | 2.7 | 2.3 | 1.4 | 1.1 | 0.7 | 0.4 | 2.7 | 0.3 | 0.5 |
| Total | 0.5 | 2.8 | 7.4 | 7.8 | 8.1 | 6.8 | 4.8 | 4.2 | 3.3 | 2.9 | 2.7 | 2.0 | 1.5 |
Exports by Country
China (2M tons) was the main destination for oil crops exports from Brazil, with a approximately 68% share of total exports.
From January 2023 to January 2024, the average monthly growth rate of volume to China amounted to +11.9%.
In value terms, China ($1B) also remains the key foreign market for oil crops exports from Brazil.
From January 2023 to January 2024, the average monthly rate of growth in terms of value to China stood at +10.4%.
Exports by Type
Soya beans (2.9M tons) was the largest type of oil crops exported from Brazil, accounting for a 99% share of total exports. It was followed by rape or colza seed (21K tons), with a 0.7% share of total exports. Sesame seed (8.6K tons) ranked third in terms of total exports with a 0.3% share.
From January 2023 to January 2024, the average monthly growth rate of the volume of export of soya beans amounted to +10.7%. With regard to the other exported products, the following average monthly rates of growth were recorded: rape or colza seed (+90.8% per month) and sesame seed (-9.9% per month).
In value terms, soya beans ($1.5B) remains the largest type of oil crops exported from Brazil, comprising 98% of total exports. The second position in the ranking was held by sesame seed ($14M), with a 0.9% share of total exports. It was followed by rape or colza seed, with a 0.7% share.
From January 2023 to January 2024, the average monthly growth rate of the export volume of soya beans stood at +9.3%. With regard to the other exported products, the following average monthly rates of growth were recorded: sesame seed (-8.3% per month) and rape or colza seed (+39.8% per month).
Export Prices by Country
In January 2024, the oil crops price amounted to $513 per ton (FOB, Brazil), waning by -1.8% against the previous month. Overall, the export price saw a slight downturn. The pace of growth was the most pronounced in September 2023 when the average export price increased by 3.1% m-o-m. Over the period under review, the average export prices reached the peak figure at $622 per ton in January 2023; however, from February 2023 to January 2024, the export prices stood at a somewhat lower figure.
Average prices varied noticeably for the major export markets. In January 2024, the countries with the highest prices were Iran ($523 per ton) and Norway ($522 per ton), while the average price for exports to Thailand ($500 per ton) and Spain ($505 per ton) were amongst the lowest.
From January 2023 to January 2024, the most notable rate of growth in terms of prices was recorded for supplies to Iran (-0.9%), while the prices for the other major destinations experienced a decline.
This report provides an in-depth analysis of the oil crops market in Brazil. Within it, you will discover the latest data on market trends and opportunities by country, consumption, production and price developments, as well as the global trade (imports and exports). The forecast exhibits the market prospects through 2030.
Product coverage:
- FCL 249 - Coconuts
- FCL 236 - Soybeans
- FCL 242 - Groundnuts, in shell
- FCL 333 - Linseed
- FCL 270 - Rapeseed or colza seed
- FCL 267 - Sunflower seed
- FCL 289 - Sesame seed
- FCL 292 - Mustard seed
- FCL 296 - Poppy seed
- FCL 265 - Castor Beans
- FCL 336 - Hempseed
- FCL 277 - Jojoba Seeds
- FCL 310 - Kapok fruit
- FCL 263 - Karite Nuts (Sheanuts)
- FCL 299 - Melonseed
- FCL 254 - [Oil palm fruit]
- FCL 339 - Oilseeds nes
- FCL 280 - Safflower seed
- FCL 305 - Tallowtree Seeds
- FCL 275 - Tung Nuts
- FCL 311 - Kapokseed in shell
- FCL 312 - Kapokseed, shelled
- FCL 329 - Cottonseed
Country coverage:
- Brazil
Data coverage:
- Market volume and value
- Per Capita consumption
- Forecast of the market dynamics in the medium term
- Trade (exports and imports) in Brazil
- Export and import prices
- Market trends, drivers and restraints
- Key market players and their profiles
Reasons to buy this report:
- Take advantage of the latest data
- Find deeper insights into current market developments
- Discover vital success factors affecting the market
This report is designed for manufacturers, distributors, importers, and wholesalers, as well as for investors, consultants and advisors.
In this report, you can find information that helps you to make informed decisions on the following issues:
- How to diversify your business and benefit from new market opportunities
- How to load your idle production capacity
- How to boost your sales on overseas markets
- How to increase your profit margins
- How to make your supply chain more sustainable
- How to reduce your production and supply chain costs
- How to outsource production to other countries
- How to prepare your business for global expansion
While doing this research, we combine the accumulated expertise of our analysts and the capabilities of artificial intelligence. The AI-based platform, developed by our data scientists, constitutes the key working tool for business analysts, empowering them to discover deep insights and ideas from the marketing data.
-
1. INTRODUCTION
Making Data-Driven Decisions to Grow Your Business
- REPORT DESCRIPTION
- RESEARCH METHODOLOGY AND AI PLATFORM
- DATA-DRIVEN DECISIONS FOR YOUR BUSINESS
- GLOSSARY AND SPECIFIC TERMS
-
2. EXECUTIVE SUMMARY
A Quick Overview of Market Performance
- KEY FINDINGS
- MARKET TRENDS This Chapter is Available Only for the Professional Edition PRO
-
3. MARKET OVERVIEW
Understanding the Current State of The Market and Its Prospects
- MARKET SIZE
- MARKET STRUCTURE
- TRADE BALANCE
- PER CAPITA CONSUMPTION
- MARKET FORECAST TO 2030
-
4. MOST PROMISING PRODUCT
Finding New Products to Diversify Your Business
This Chapter is Available Only for the Professional Edition PRO- TOP PRODUCTS TO DIVERSIFY YOUR BUSINESS
- BEST-SELLING PRODUCTS
- MOST CONSUMED PRODUCT
- MOST TRADED PRODUCT
- MOST PROFITABLE PRODUCT FOR EXPORT
-
5. MOST PROMISING SUPPLYING COUNTRIES
Choosing the Best Countries to Establish Your Sustainable Supply Chain
This Chapter is Available Only for the Professional Edition PRO- TOP COUNTRIES TO SOURCE YOUR PRODUCT
- TOP PRODUCING COUNTRIES
- COUNTRIES WITH TOP YIELDS
- TOP EXPORTING COUNTRIES
- LOW-COST EXPORTING COUNTRIES
-
6. MOST PROMISING OVERSEAS MARKETS
Choosing the Best Countries to Boost Your Exports
This Chapter is Available Only for the Professional Edition PRO- TOP OVERSEAS MARKETS FOR EXPORTING YOUR PRODUCT
- TOP CONSUMING MARKETS
- UNSATURATED MARKETS
- TOP IMPORTING MARKETS
- MOST PROFITABLE MARKETS
7. PRODUCTION
The Latest Trends and Insights into The Industry
- PRODUCTION, HARVESTED AREA AND YIELD
8. IMPORTS
The Largest Import Supplying Countries
- IMPORTS FROM 2012–2023
- IMPORTS BY COUNTRY
- IMPORT PRICES BY COUNTRY
9. EXPORTS
The Largest Destinations for Exports
- EXPORTS FROM 2012–2023
- EXPORTS BY COUNTRY
- EXPORT PRICES BY COUNTRY
-
10. PROFILES OF MAJOR PRODUCERS
The Largest Producers on The Market and Their Profiles
This Chapter is Available Only for the Professional Edition PRO -
LIST OF TABLES
- Key Findings In 2023
- Market Volume, In Physical Terms, 2012–2023
- Market Value, 2012–2023
- Per Capita Consumption In 2012-2023
- Imports, In Physical Terms, By Country, 2012–2023
- Imports, In Value Terms, By Country, 2012–2023
- Import Prices, By Country Of Origin, 2012–2023
- Exports, In Physical Terms, By Country, 2012–2023
- Exports, In Value Terms, By Country, 2012–2023
- Export Prices, By Country Of Destination, 2012–2023
-
LIST OF FIGURES
- Market Volume, In Physical Terms, 2012–2023
- Market Value, 2012–2023
- Market Structure – Domestic Supply vs. Imports, In Physical Terms, 2012-2023
- Market Structure – Domestic Supply vs. Imports, In Value Terms, 2012-2023
- Trade Balance, In Physical Terms, 2012-2023
- Trade Balance, In Value Terms, 2012-2023
- Per Capita Consumption, 2012-2023
- Market Volume Forecast to 2030
- Market Value Forecast to 2030
- Products: Market Size And Growth, By Type
- Products: Average Per Capita Consumption, By Type
- Products: Exports And Growth, By Type
- Products: Export Prices And Growth, By Type
- Production Volume And Growth
- Yield And Growth
- Exports And Growth
- Export Prices And Growth
- Market Size And Growth
- Per Capita Consumption
- Imports And Growth
- Import Prices
- Production, In Physical Terms, 2012–2023
- Production, In Value Terms, 2012–2023
- Area Harvested, 2012–2023
- Yield, 2012–2023
- Imports, In Physical Terms, 2012–2023
- Imports, In Value Terms, 2012–2023
- Imports, In Physical Terms, By Country, 2023
- Imports, In Physical Terms, By Country, 2012–2023
- Imports, In Value Terms, By Country, 2012–2023
- Import Prices, By Country Of Origin, 2012–2023
- Exports, In Physical Terms, 2012–2023
- Exports, In Value Terms, 2012–2023
- Exports, In Physical Terms, By Country, 2023
- Exports, In Physical Terms, By Country, 2012–2023
- Exports, In Value Terms, By Country, 2012–2023
- Export Prices, By Country Of Destination, 2012–2023


