
United Kingdom - Bread and Bakery Product - Market Analysis, Forecast, Size, Trends and Insights
Get instant access to more than 2 million reports, dashboards, and datasets on the IndexBox Platform.
View PricingUK Imports $388M Worth of Bread and Bakery Products in June 2023
United Kingdom Bread and Bakery Imports
In June 2023, bread and bakery imports into the UK dropped slightly to 95K tons, almost unchanged from the previous month's figure. In general, imports, however, continue to indicate a relatively flat trend pattern. The pace of growth appeared the most rapid in March 2023 when imports increased by 15% m-o-m.
In value terms, bread and bakery imports reached $388M (IndexBox estimates) in June 2023. The total import value increased at an average monthly rate of +2.0% from June 2022 to June 2023; the trend pattern indicated some noticeable fluctuations being recorded throughout the analyzed period. The most prominent rate of growth was recorded in March 2023 when imports increased by 21% against the previous month. Over the period under review, imports attained the maximum in June 2023.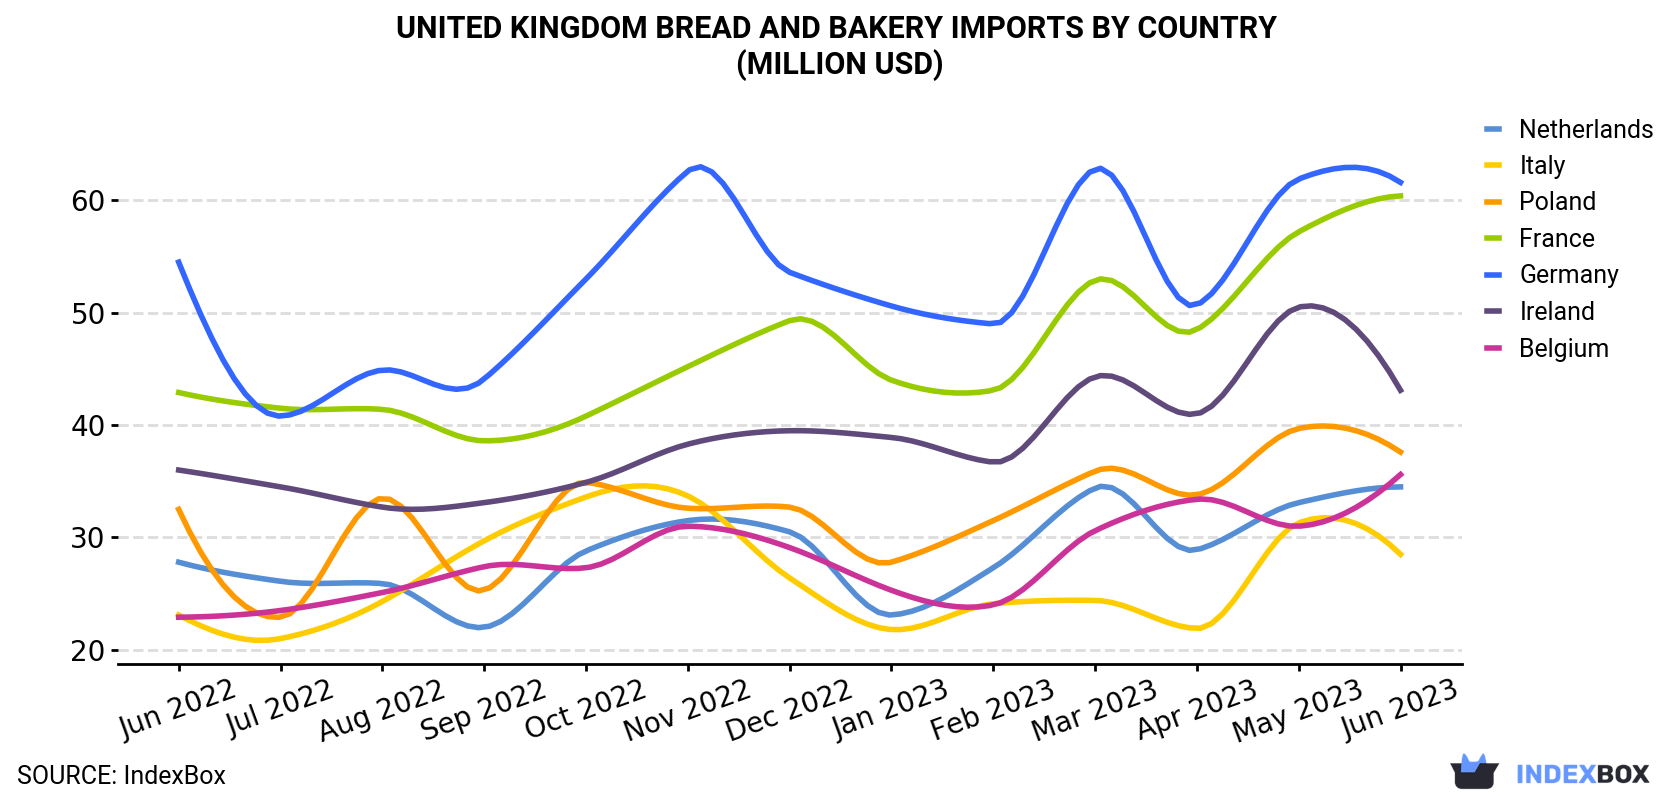
| COUNTRY | Import Value of Bread and Bakery in United Kingdom (million USD) | ||||||||||||
|---|---|---|---|---|---|---|---|---|---|---|---|---|---|
| Jun 2022 | Jul 2022 | Aug 2022 | Sep 2022 | Oct 2022 | Nov 2022 | Dec 2022 | Jan 2023 | Feb 2023 | Mar 2023 | Apr 2023 | May 2023 | Jun 2023 | |
| Germany | 54.5 | 40.8 | 44.9 | 44.1 | 53.0 | 62.6 | 53.6 | 50.6 | 49.0 | 62.8 | 50.7 | 61.9 | 61.6 |
| France | 42.9 | 41.5 | 41.4 | 38.6 | 40.8 | 45.2 | 49.3 | 44.0 | 43.1 | 52.9 | 48.5 | 57.2 | 60.4 |
| Ireland | 36.0 | 34.5 | 32.7 | 33.1 | 34.9 | 38.3 | 39.5 | 38.9 | 36.7 | 44.3 | 41.0 | 50.5 | 43.1 |
| Poland | 32.5 | 22.9 | 33.5 | 25.3 | 34.9 | 32.6 | 32.7 | 27.8 | 31.5 | 35.9 | 33.8 | 39.7 | 37.6 |
| Belgium | 22.9 | 23.5 | 25.1 | 27.4 | 27.3 | 31.0 | 29.1 | 25.3 | 24.0 | 30.6 | 33.4 | 31.0 | 35.6 |
| Netherlands | 27.8 | 26.1 | 25.9 | 22.0 | 28.8 | 31.5 | 30.5 | 23.1 | 27.3 | 34.4 | 28.9 | 33.1 | 34.5 |
| Italy | 23.1 | 21.0 | 24.3 | 29.7 | 33.6 | 33.7 | 26.4 | 21.8 | 24.1 | 24.4 | 21.9 | 31.3 | 28.5 |
| Others | 67.6 | 66.8 | 64.4 | 64.8 | 73.7 | 72.4 | 74.5 | 66.4 | 66.0 | 78.0 | 71.6 | 82.7 | 86.6 |
| Total | 307 | 277 | 292 | 285 | 327 | 347 | 336 | 298 | 301 | 363 | 330 | 387 | 388 |
Imports by Country
France (15K tons), Germany (15K tons) and Ireland (15K tons) were the main suppliers of bread and bakery imports to the UK, together comprising 46% of total imports. The Netherlands, Belgium, Poland and Italy lagged somewhat behind, together comprising a further 32%.
From June 2022 to June 2023, the biggest increases were in Belgium (with a CAGR of +2.1%), while purchases for the other leaders experienced more modest paces of growth.
In value terms, the largest bread and bakery suppliers to the UK were Germany ($62M), France ($60M) and Ireland ($43M), with a combined 43% share of total imports. These countries were followed by Poland, Belgium, the Netherlands and Italy, which together accounted for a further 35%.
Among the main suppliers, Belgium, with a CAGR of +3.8%, recorded the highest growth rate of the value of imports, over the period under review, while purchases for the other leaders experienced more modest paces of growth.
Imports by Type
In June 2023, fresh bread and miscellaneous bakery (70K tons) constituted the largest type of bread and bakery supplied to the UK, with a 74% share of total imports. Moreover, fresh bread and miscellaneous bakery exceeded the figures recorded for the second-largest type, gingerbread, sweet biscuits and waffles (24K tons), threefold.
From June 2022 to June 2023, the average monthly growth rate of the volume of import of fresh bread and miscellaneous bakery was relatively modest. With regard to the other supplied products, the following average monthly rates of growth were recorded: gingerbread, sweet biscuits and waffles (-0.1% per month) and crispbread, rusks and toasted bread (+0.1% per month).
In value terms, fresh bread and miscellaneous bakery ($271M) constituted the largest type of bread and bakery supplied to the UK, comprising 70% of total imports. The second position in the ranking was held by gingerbread, sweet biscuits and waffles ($112M), with a 29% share of total imports.
Import Prices by Country
In June 2023, the bread and bakery price stood at $4,063 per ton (CIF, United Kingdom), almost unchanged from the previous month. Over the last twelve months, it increased at an average monthly rate of +1.5%. The most prominent rate of growth was recorded in November 2022 when the average import price increased by 14% m-o-m. The import price peaked in June 2023.
Prices varied noticeably by the country of origin: the country with the highest price was Poland ($5,120 per ton), while the price for Ireland ($2,961 per ton) was amongst the lowest.
From June 2022 to June 2023, the most notable rate of growth in terms of prices was attained by Germany (+2.3%), while the prices for the other major suppliers experienced more modest paces of growth.
This report provides an in-depth analysis of the bread and bakery market in the UK. Within it, you will discover the latest data on market trends and opportunities by country, consumption, production and price developments, as well as the global trade (imports and exports). The forecast exhibits the market prospects through 2030.
Product coverage:
- Prodcom 10721130 - Crispbread
- Prodcom 10721230 - Gingerbread and the like
- Prodcom 10721255 - Sweet biscuits (including sandwich biscuits, excluding those completely or partially coated or covered with chocolate or other preparations containing cocoa)
- Prodcom 10721259 - Waffles and wafers (including salted) (excluding those completely or partially coated or covered with chocolate or other preparations containing cocoa)
- Prodcom 10721150 - Rusks, toasted bread and similar toasted products
- Prodcom 10711100 - Fresh bread containing by weight in the dry matter state . 5 % of sugars and . 5 % of fat (excluding with added honey, e ggs, cheese or fruit)
- Prodcom 10711200 - Cake and pastry products, other bakers
- Prodcom 10721910 - Matzos
- Prodcom 10721920 - Communion wafers, empty cachets of a kind suitable for pharmaceutical use, sealing wafers, rice paper and similar products
- Prodcom 10721940 - Biscuits (excluding those completely or partially coated or covered with chocolate or other preparations containing cocoa, sweet biscuits, waffles and wafers)
- Prodcom 10721950 - Savoury or salted extruded or expanded products
- Prodcom 10721990 - Bakersu2019 wares, no added sweetening (including crepes, pancakes, quiche, pizza; excluding sandwiches, crispbread, waffles, wafers, rusks, toasted, savoury or salted extruded/expanded products)
Country coverage:
- United Kingdom
Data coverage:
- Market volume and value
- Per Capita consumption
- Forecast of the market dynamics in the medium term
- Trade (exports and imports) in the UK
- Export and import prices
- Market trends, drivers and restraints
- Key market players and their profiles
Reasons to buy this report:
- Take advantage of the latest data
- Find deeper insights into current market developments
- Discover vital success factors affecting the market
This report is designed for manufacturers, distributors, importers, and wholesalers, as well as for investors, consultants and advisors.
In this report, you can find information that helps you to make informed decisions on the following issues:
- How to diversify your business and benefit from new market opportunities
- How to load your idle production capacity
- How to boost your sales on overseas markets
- How to increase your profit margins
- How to make your supply chain more sustainable
- How to reduce your production and supply chain costs
- How to outsource production to other countries
- How to prepare your business for global expansion
While doing this research, we combine the accumulated expertise of our analysts and the capabilities of artificial intelligence. The AI-based platform, developed by our data scientists, constitutes the key working tool for business analysts, empowering them to discover deep insights and ideas from the marketing data.
-
1. INTRODUCTION
Making Data-Driven Decisions to Grow Your Business
- REPORT DESCRIPTION
- RESEARCH METHODOLOGY AND AI PLATFORM
- DATA-DRIVEN DECISIONS FOR YOUR BUSINESS
- GLOSSARY AND SPECIFIC TERMS
-
2. EXECUTIVE SUMMARY
A Quick Overview of Market Performance
- KEY FINDINGS
- MARKET TRENDS This Chapter is Available Only for the Professional Edition PRO
-
3. MARKET OVERVIEW
Understanding the Current State of The Market and Its Prospects
- MARKET SIZE
- MARKET STRUCTURE
- TRADE BALANCE
- PER CAPITA CONSUMPTION
- MARKET FORECAST TO 2030
-
4. MOST PROMISING PRODUCT
Finding New Products to Diversify Your Business
This Chapter is Available Only for the Professional Edition PRO- TOP PRODUCTS TO DIVERSIFY YOUR BUSINESS
- BEST-SELLING PRODUCTS
- MOST CONSUMED PRODUCT
- MOST TRADED PRODUCT
- MOST PROFITABLE PRODUCT FOR EXPORT
-
5. MOST PROMISING SUPPLYING COUNTRIES
Choosing the Best Countries to Establish Your Sustainable Supply Chain
This Chapter is Available Only for the Professional Edition PRO- TOP COUNTRIES TO SOURCE YOUR PRODUCT
- TOP PRODUCING COUNTRIES
- TOP EXPORTING COUNTRIES
- LOW-COST EXPORTING COUNTRIES
-
6. MOST PROMISING OVERSEAS MARKETS
Choosing the Best Countries to Boost Your Exports
This Chapter is Available Only for the Professional Edition PRO- TOP OVERSEAS MARKETS FOR EXPORTING YOUR PRODUCT
- TOP CONSUMING MARKETS
- UNSATURATED MARKETS
- TOP IMPORTING MARKETS
- MOST PROFITABLE MARKETS
7. PRODUCTION
The Latest Trends and Insights into The Industry
- PRODUCTION VOLUME AND VALUE
8. IMPORTS
The Largest Import Supplying Countries
- IMPORTS FROM 2012–2023
- IMPORTS BY COUNTRY
- IMPORT PRICES BY COUNTRY
9. EXPORTS
The Largest Destinations for Exports
- EXPORTS FROM 2012–2023
- EXPORTS BY COUNTRY
- EXPORT PRICES BY COUNTRY
-
10. PROFILES OF MAJOR PRODUCERS
The Largest Producers on The Market and Their Profiles
This Chapter is Available Only for the Professional Edition PRO -
LIST OF TABLES
- Key Findings In 2023
- Market Volume, In Physical Terms, 2012–2023
- Market Value, 2012–2023
- Per Capita Consumption In 2012-2023
- Imports, In Physical Terms, By Country, 2012–2023
- Imports, In Value Terms, By Country, 2012–2023
- Import Prices, By Country Of Origin, 2012–2023
- Exports, In Physical Terms, By Country, 2012–2023
- Exports, In Value Terms, By Country, 2012–2023
- Export Prices, By Country Of Destination, 2012–2023
-
LIST OF FIGURES
- Market Volume, In Physical Terms, 2012–2023
- Market Value, 2012–2023
- Market Structure – Domestic Supply vs. Imports, In Physical Terms, 2012-2023
- Market Structure – Domestic Supply vs. Imports, In Value Terms, 2012-2023
- Trade Balance, In Physical Terms, 2012-2023
- Trade Balance, In Value Terms, 2012-2023
- Per Capita Consumption, 2012-2023
- Market Volume Forecast to 2030
- Market Value Forecast to 2030
- Products: Market Size And Growth, By Type
- Products: Average Per Capita Consumption, By Type
- Products: Exports And Growth, By Type
- Products: Export Prices And Growth, By Type
- Production Volume And Growth
- Exports And Growth
- Export Prices And Growth
- Market Size And Growth
- Per Capita Consumption
- Imports And Growth
- Import Prices
- Production, In Physical Terms, 2012–2023
- Production, In Value Terms, 2012–2023
- Imports, In Physical Terms, 2012–2023
- Imports, In Value Terms, 2012–2023
- Imports, In Physical Terms, By Country, 2023
- Imports, In Physical Terms, By Country, 2012–2023
- Imports, In Value Terms, By Country, 2012–2023
- Import Prices, By Country Of Origin, 2012–2023
- Exports, In Physical Terms, 2012–2023
- Exports, In Value Terms, 2012–2023
- Exports, In Physical Terms, By Country, 2023
- Exports, In Physical Terms, By Country, 2012–2023
- Exports, In Value Terms, By Country, 2012–2023
- Export Prices, By Country Of Destination, 2012–2023


