UK Imports of Stationery Products Decline to $310M in 2023
United Kingdom Stationery Product Imports
In 2023, purchases abroad of stationery products decreased by -13.6% to 91K tons, falling for the sixth year in a row after five years of growth. Overall, imports showed a abrupt decrease. The growth pace was the most rapid in 2014 when imports increased by 5.1%. Imports peaked at 190K tons in 2017; however, from 2018 to 2023, imports failed to regain momentum.
In value terms, stationery product imports reduced to $310M (IndexBox estimates) in 2023. In general, imports saw a noticeable curtailment. The growth pace was the most rapid in 2022 with an increase of 11% against the previous year. Over the period under review, imports attained the maximum at $472M in 2014; however, from 2015 to 2023, imports stood at a somewhat lower figure.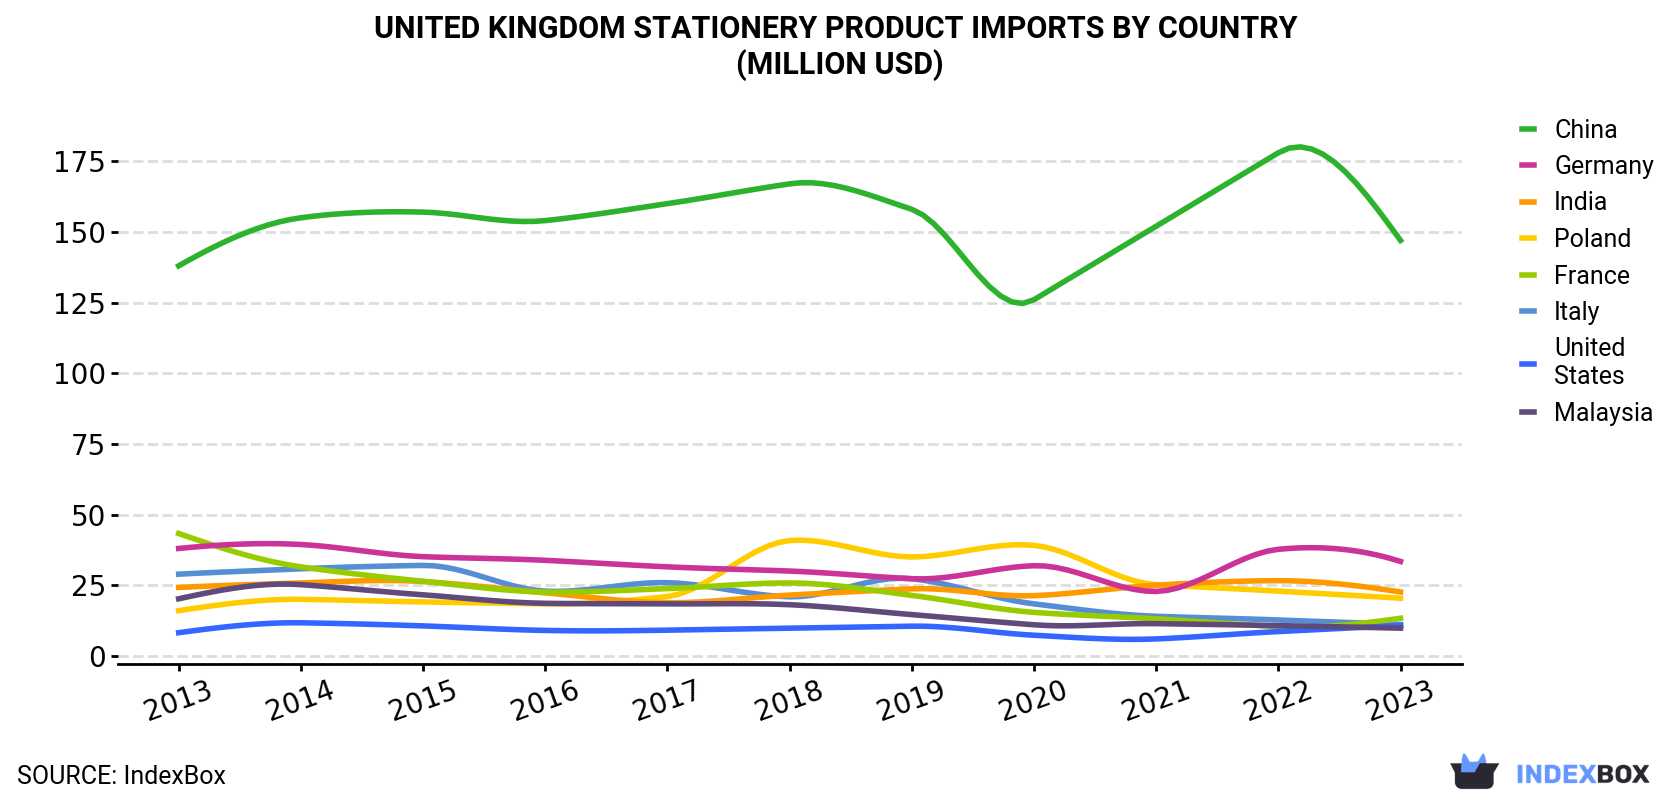
| COUNTRY | Import Value of Stationery Product in United Kingdom (million USD) | ||||||||||
|---|---|---|---|---|---|---|---|---|---|---|---|
| 2013 | 2014 | 2015 | 2016 | 2017 | 2018 | 2019 | 2020 | 2021 | 2022 | 2023 | |
| China | 138 | 155 | 157 | 154 | 160 | 167 | 158 | 126 | 152 | 178 | 147 |
| Germany | 38.0 | 39.4 | 35.1 | 33.8 | 31.5 | 30.0 | 27.3 | 31.9 | 22.8 | 37.7 | 33.4 |
| India | 24.2 | 25.8 | 26.3 | 22.3 | 18.8 | 21.5 | 23.7 | 21.3 | 25.0 | 26.6 | 22.6 |
| Poland | 16.0 | 20.0 | 19.1 | 18.4 | 21.0 | 40.8 | 35.0 | 39.1 | 25.2 | 22.9 | 20.4 |
| France | 43.3 | 31.5 | 26.4 | 22.6 | 23.8 | 25.8 | 21.4 | 15.4 | 13.1 | 10.3 | 13.3 |
| Italy | 28.9 | 30.8 | 32.0 | 22.9 | 25.9 | 20.9 | 27.3 | 18.4 | 14.0 | 12.7 | 11.1 |
| United States | 8.2 | 11.7 | 10.6 | 9.0 | 9.1 | 9.8 | 10.5 | 7.3 | 6.0 | 8.6 | 10.7 |
| Malaysia | 20.2 | 25.2 | 21.6 | 18.6 | 18.4 | 18.1 | 14.6 | 11.0 | 11.4 | 10.7 | 9.8 |
| Others | 124 | 133 | 122 | 110 | 110 | 110 | 84.9 | 68.7 | 51.8 | 47.8 | 41.1 |
| Total | 440 | 472 | 451 | 412 | 418 | 445 | 403 | 339 | 321 | 356 | 310 |
Imports by Country
China (39K tons), Germany (23K tons) and India (8.5K tons) were the main suppliers of stationery product imports to the UK, together comprising 78% of total imports.
From 2013 to 2023, the biggest increases were recorded for Germany (with a CAGR of +3.7%), while purchases for the other leaders experienced a decline.
In value terms, China ($147M) constituted the largest supplier of stationery products to the UK, comprising 47% of total imports. The second position in the ranking was taken by Germany ($33M), with an 11% share of total imports. It was followed by India, with a 7.3% share.
From 2013 to 2023, the average annual growth rate of value from China was relatively modest. The remaining supplying countries recorded the following average annual rates of imports growth: Germany (-1.3% per year) and India (-0.7% per year).
Imports by Type
Registers, account books, order books and receipt books (38K tons), uncoated paper and paperboard; in square or rectangular sheets with one side <= 435 mm and the other side <= 297 mm in the unfolded state (21K tons) and envelopes (18K tons) were the main products of stationery product imports to the UK, with a combined 81% share of total imports. Paper binders, folders and file covers, blotting pads and book covers, uncoated paper and paperboard in square with one side > 435 mm or with one side <= 435 mm and the other side > 297 mm in the unfolded state, boxes, pouches, wallets and writing compendiums of paper, albums for samples, collections, stamps or photographs, handmade paper and paperboard, letter cards, plain postcards and correspondence cards and manifold business forms and interleaved carbon sets lagged somewhat behind, together accounting for a further 19%.
From 2013 to 2023, the most notable rate of growth in terms of purchases, amongst the major product types, was attained by handmade paper and paperboard (with a CAGR of +4.1%), while imports for the other products experienced a decline.
In value terms, registers, account books, order books and receipt books ($162M) constituted the largest type of stationery products supplied to the UK, comprising 52% of total imports. The second position in the ranking was held by envelopes ($43M), with a 14% share of total imports. It was followed by uncoated paper and paperboard; in square or rectangular sheets with one side <= 435 mm and the other side <= 297 mm in the unfolded state, with a 9.1% share.
Import Prices by Country
In 2023, the stationery product price stood at $3,422 per ton (CIF, United Kingdom), approximately reflecting the previous year. Over the period under review, import price indicated a notable increase from 2013 to 2023: its price increased at an average annual rate of +3.0% over the last decade. The trend pattern, however, indicated some noticeable fluctuations being recorded throughout the analyzed period. Based on 2023 figures, stationery product import price increased by +55.6% against 2017 indices. The most prominent rate of growth was recorded in 2021 an increase of 15%. Over the period under review, average import prices hit record highs in 2023 and is expected to retain growth in years to come.
Prices varied noticeably by country of origin: amid the top importers, the country with the highest price was Italy ($6,049 per ton), while the price for Germany ($1,457 per ton) was amongst the lowest.
From 2013 to 2023, the most notable rate of growth in terms of prices was attained by Portugal (+6.3%), while the prices for the other major suppliers experienced more modest paces of growth.
-
1. INTRODUCTION
Making Data-Driven Decisions to Grow Your Business
- REPORT DESCRIPTION
- RESEARCH METHODOLOGY AND AI PLATFORM
- DATA-DRIVEN DECISIONS FOR YOUR BUSINESS
- GLOSSARY AND SPECIFIC TERMS
-
2. EXECUTIVE SUMMARY
A Quick Overview of Market Performance
- KEY FINDINGS
- MARKET TRENDS This Chapter is Available Only for the Professional Edition PRO
-
3. MARKET OVERVIEW
Understanding the Current State of The Market and Its Prospects
- MARKET SIZE
- MARKET STRUCTURE
- TRADE BALANCE
- PER CAPITA CONSUMPTION
- MARKET FORECAST TO 2030
-
4. MOST PROMISING PRODUCT
Finding New Products to Diversify Your Business
This Chapter is Available Only for the Professional Edition PRO- TOP PRODUCTS TO DIVERSIFY YOUR BUSINESS
- BEST-SELLING PRODUCTS
- MOST CONSUMED PRODUCT
- MOST TRADED PRODUCT
- MOST PROFITABLE PRODUCT FOR EXPORT
-
5. MOST PROMISING SUPPLYING COUNTRIES
Choosing the Best Countries to Establish Your Sustainable Supply Chain
This Chapter is Available Only for the Professional Edition PRO- TOP COUNTRIES TO SOURCE YOUR PRODUCT
- TOP PRODUCING COUNTRIES
- TOP EXPORTING COUNTRIES
- LOW-COST EXPORTING COUNTRIES
-
6. MOST PROMISING OVERSEAS MARKETS
Choosing the Best Countries to Boost Your Exports
This Chapter is Available Only for the Professional Edition PRO- TOP OVERSEAS MARKETS FOR EXPORTING YOUR PRODUCT
- TOP CONSUMING MARKETS
- UNSATURATED MARKETS
- TOP IMPORTING MARKETS
- MOST PROFITABLE MARKETS
7. PRODUCTION
The Latest Trends and Insights into The Industry
- PRODUCTION VOLUME AND VALUE
8. IMPORTS
The Largest Import Supplying Countries
- IMPORTS FROM 2012–2023
- IMPORTS BY COUNTRY
- IMPORT PRICES BY COUNTRY
9. EXPORTS
The Largest Destinations for Exports
- EXPORTS FROM 2012–2023
- EXPORTS BY COUNTRY
- EXPORT PRICES BY COUNTRY
-
10. PROFILES OF MAJOR PRODUCERS
The Largest Producers on The Market and Their Profiles
This Chapter is Available Only for the Professional Edition PRO -
LIST OF TABLES
- Key Findings In 2023
- Market Volume, In Physical Terms, 2012–2023
- Market Value, 2012–2023
- Per Capita Consumption In 2012-2023
- Imports, In Physical Terms, By Country, 2012–2023
- Imports, In Value Terms, By Country, 2012–2023
- Import Prices, By Country Of Origin, 2012–2023
- Exports, In Physical Terms, By Country, 2012–2023
- Exports, In Value Terms, By Country, 2012–2023
- Export Prices, By Country Of Destination, 2012–2023
-
LIST OF FIGURES
- Market Volume, In Physical Terms, 2012–2023
- Market Value, 2012–2023
- Market Structure – Domestic Supply vs. Imports, In Physical Terms, 2012-2023
- Market Structure – Domestic Supply vs. Imports, In Value Terms, 2012-2023
- Trade Balance, In Physical Terms, 2012-2023
- Trade Balance, In Value Terms, 2012-2023
- Per Capita Consumption, 2012-2023
- Market Volume Forecast to 2030
- Market Value Forecast to 2030
- Products: Market Size And Growth, By Type
- Products: Average Per Capita Consumption, By Type
- Products: Exports And Growth, By Type
- Products: Export Prices And Growth, By Type
- Production Volume And Growth
- Exports And Growth
- Export Prices And Growth
- Market Size And Growth
- Per Capita Consumption
- Imports And Growth
- Import Prices
- Production, In Physical Terms, 2012–2023
- Production, In Value Terms, 2012–2023
- Imports, In Physical Terms, 2012–2023
- Imports, In Value Terms, 2012–2023
- Imports, In Physical Terms, By Country, 2023
- Imports, In Physical Terms, By Country, 2012–2023
- Imports, In Value Terms, By Country, 2012–2023
- Import Prices, By Country Of Origin, 2012–2023
- Exports, In Physical Terms, 2012–2023
- Exports, In Value Terms, 2012–2023
- Exports, In Physical Terms, By Country, 2023
- Exports, In Physical Terms, By Country, 2012–2023
- Exports, In Value Terms, By Country, 2012–2023
- Export Prices, By Country Of Destination, 2012–2023


