World - Coconut - Market Analysis, Forecast, Size, Trends and Insights
Get instant access to more than 2 million reports, dashboards, and datasets on the IndexBox Platform.
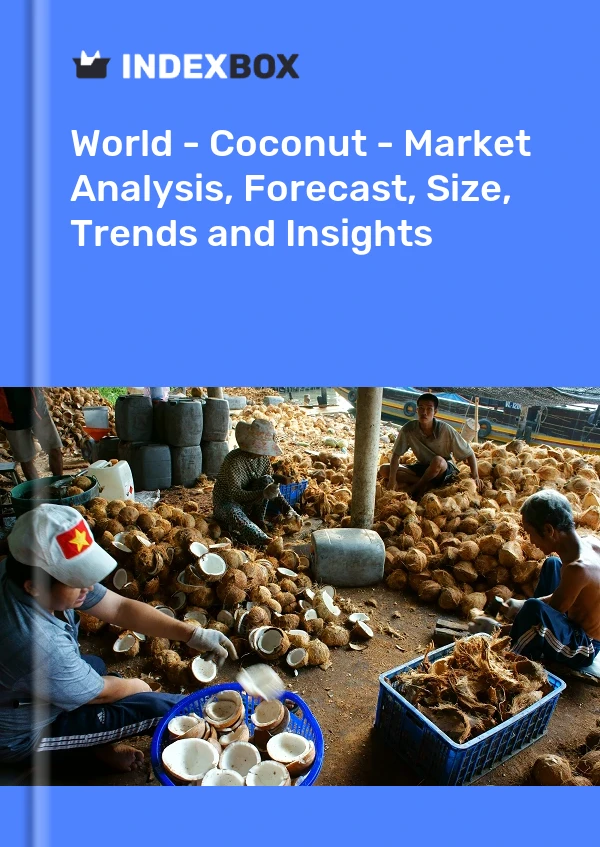
View PricingCoconut Market
The global coconut market is projected to experience a modest increase in consumption and market value from 2022 to 2030. Key findings include a CAGR of +1.0% in market volume, bringing it to 67M tons by 2030, and a CAGR of +2.9% in market value, reaching $55.3B by the end of 2030. Indonesia, the Philippines, and India are the top consumers and producers of coconuts, with China showing significant growth in consumption. Imports and exports also saw steady increases, with China and Thailand leading in exports and imports respectively.
Market Forecast
Driven by rising demand for coconut worldwide, the market is expected to start an upward consumption trend over the next eight years. The performance of the market is forecast to increase slightly, with an anticipated CAGR of +1.0% for the period from 2022 to 2030, which is projected to bring the market volume to 67M tons by the end of 2030.
In value terms, the market is forecast to increase with an anticipated CAGR of +2.9% for the period from 2022 to 2030, which is projected to bring the market value to $55.3B (in nominal prices) by the end of 2030.
Consumption
World Consumption of Coconut
In 2022, the amount of coconuts consumed worldwide reduced modestly to 62M tons, approximately reflecting the previous year. Overall, consumption showed a relatively flat trend pattern. As a result, consumption reached the peak volume of 66M tons. From 2019 to 2022, the growth of the global consumption remained at a lower figure.
The global coconut market revenue reduced slightly to $43.9B in 2022, approximately mirroring the previous year. This figure reflects the total revenues of producers and importers (excluding logistics costs, retail marketing costs, and retailers' margins, which will be included in the final consumer price). The market value increased at an average annual rate of +1.7% from 2012 to 2022; the trend pattern remained relatively stable, with only minor fluctuations being recorded in certain years. Over the period under review, the global market hit record highs at $49.4B in 2018; however, from 2019 to 2022, consumption failed to regain momentum.
Consumption By Country
The countries with the highest volumes of consumption in 2022 were Indonesia (17M tons), the Philippines (15M tons) and India (13M tons), with a combined 72% share of global consumption. Brazil, Sri Lanka, Vietnam, China, Papua New Guinea, Myanmar and Mexico lagged somewhat behind, together comprising a further 19%.
From 2012 to 2022, the most notable rate of growth in terms of consumption, amongst the main consuming countries, was attained by China (with a CAGR of +13.3%), while consumption for the other global leaders experienced more modest paces of growth.
In value terms, the largest coconut markets worldwide were the Philippines ($13.6B), India ($12.3B) and Indonesia ($4.4B), with a combined 69% share of the global market. Brazil, Sri Lanka, Vietnam, China, Myanmar, Papua New Guinea and Mexico lagged somewhat behind, together comprising a further 13%.
China, with a CAGR of +15.4%, recorded the highest growth rate of market size among the main consuming countries over the period under review, while market for the other global leaders experienced more modest paces of growth.
The countries with the highest levels of coconut per capita consumption in 2022 were Papua New Guinea (135 kg per person), the Philippines (133 kg per person) and Sri Lanka (99 kg per person).
From 2012 to 2022, the most notable rate of growth in terms of consumption, amongst the leading consuming countries, was attained by China (with a CAGR of +12.8%), while consumption for the other global leaders experienced more modest paces of growth.
Production
World Production of Coconut
In 2022, the amount of coconuts produced worldwide contracted slightly to 62M tons, remaining relatively unchanged against 2021. Overall, production continues to indicate a relatively flat trend pattern. The most prominent rate of growth was recorded in 2018 when the production volume increased by 11% against the previous year. As a result, production reached the peak volume of 65M tons. From 2019 to 2022, global production growth remained at a somewhat lower figure. The general negative trend in terms output was largely conditioned by a relatively flat trend pattern of the harvested area and a relatively flat trend pattern in yield figures.
In value terms, coconut production declined to $50B in 2022 estimated in export price. In general, the total production indicated a tangible expansion from 2012 to 2022: its value increased at an average annual rate of +3.3% over the last decade. The trend pattern, however, indicated some noticeable fluctuations being recorded throughout the analyzed period. Based on 2022 figures, production increased by +8.4% against 2019 indices. The growth pace was the most rapid in 2017 with an increase of 59% against the previous year. Over the period under review, global production hit record highs at $57.6B in 2018; however, from 2019 to 2022, production stood at a somewhat lower figure.
Production By Country
The countries with the highest volumes of production in 2022 were Indonesia (17M tons), the Philippines (15M tons) and India (13M tons), with a combined 73% share of global production. Brazil, Sri Lanka, Vietnam, Papua New Guinea, Myanmar and Mexico lagged somewhat behind, together comprising a further 17%.
From 2012 to 2022, the most notable rate of growth in terms of production, amongst the main producing countries, was attained by Vietnam (with a CAGR of +4.3%), while production for the other global leaders experienced more modest paces of growth.
Yield
The global average coconut yield dropped modestly to 5.6 tons per ha in 2022, leveling off at 2021 figures. Over the period under review, the yield, however, showed a relatively flat trend pattern. The most prominent rate of growth was recorded in 2018 with an increase of 11% against the previous year. As a result, the yield attained the peak level of 5.9 tons per ha. From 2019 to 2022, the growth of the average coconut yield remained at a lower figure.
Harvested Area
The global coconut harvested area fell to 11M ha in 2022, approximately mirroring 2021 figures. In general, the harvested area continues to indicate a relatively flat trend pattern. The most prominent rate of growth was recorded in 2019 when the harvested area increased by 1.4% against the previous year. Over the period under review, the harvested area dedicated to coconut production attained the peak figure at 11M ha in 2012; however, from 2013 to 2022, the harvested area remained at a lower figure.
Imports
World Imports of Coconut
In 2022, approx. 1.8M tons of coconuts were imported worldwide; surging by 8.3% compared with the previous year's figure. Overall, imports continue to indicate a remarkable increase. The growth pace was the most rapid in 2017 with an increase of 69% against the previous year. Over the period under review, global imports reached the maximum in 2022 and are expected to retain growth in the immediate term.
In value terms, coconut imports stood at $941M in 2022. Over the period under review, imports recorded a prominent expansion. The pace of growth appeared the most rapid in 2017 when imports increased by 35%. Global imports peaked in 2022 and are likely to see gradual growth in the immediate term.
Imports By Country
China represented the main importing country with an import of about 1.1M tons, which reached 61% of total imports. Malaysia (252K tons) ranks second in terms of the total imports with a 14% share, followed by Thailand (8.1%). The following importers - the United Arab Emirates (55K tons) and the United States (48K tons) - each accounted for a 5.8% share of total imports.
China was also the fastest-growing in terms of the coconuts imports, with a CAGR of +19.7% from 2012 to 2022. At the same time, Thailand (+17.8%), Malaysia (+13.7%) and the United Arab Emirates (+7.9%) displayed positive paces of growth. The United States experienced a relatively flat trend pattern. China (+24 p.p.) and Thailand (+2.4 p.p.) significantly strengthened its position in terms of the global imports, while the United Arab Emirates and the United States saw its share reduced by -2.2% and -7.3% from 2012 to 2022, respectively. The shares of the other countries remained relatively stable throughout the analyzed period.
In value terms, China ($572M) constitutes the largest market for imported coconuts worldwide, comprising 61% of global imports. The second position in the ranking was held by Malaysia ($56M), with a 6% share of global imports. It was followed by the United States, with a 5.4% share.
In China, coconut imports expanded at an average annual rate of +24.4% over the period from 2012-2022. In the other countries, the average annual rates were as follows: Malaysia (+17.6% per year) and the United States (+2.3% per year).
Import Prices By Country
In 2022, the average coconut import price amounted to $534 per ton, approximately reflecting the previous year. Overall, the import price, however, continues to indicate a relatively flat trend pattern. The most prominent rate of growth was recorded in 2016 an increase of 32%. As a result, import price attained the peak level of $592 per ton. From 2017 to 2022, the average import prices remained at a lower figure.
Prices varied noticeably by country of destination: amid the top importers, the country with the highest price was the United States ($1,073 per ton), while Malaysia ($224 per ton) was amongst the lowest.
From 2012 to 2022, the most notable rate of growth in terms of prices was attained by China (+4.0%), while the other global leaders experienced more modest paces of growth.
Exports
World Exports of Coconut
For the fourth year in a row, the global market recorded growth in overseas shipments of coconuts, which increased by 3.6% to 1.8M tons in 2022. In general, exports saw a resilient expansion. The growth pace was the most rapid in 2017 with an increase of 45% against the previous year. The global exports peaked in 2022 and are likely to see steady growth in the immediate term.
In value terms, coconut exports declined modestly to $818M in 2022. Overall, exports showed prominent growth. The pace of growth appeared the most rapid in 2014 when exports increased by 40%. Over the period under review, the global exports hit record highs at $820M in 2021, and then shrank modestly in the following year.
Exports By Country
Indonesia (665K tons) and Thailand (567K tons) were the major exporters of coconuts in 2022, accounting for near 38% and 32% of total exports, respectively. It was distantly followed by Vietnam (286K tons), constituting a 16% share of total exports. India (70K tons), Cote d'Ivoire (28K tons) and Sri Lanka (28K tons) followed a long way behind the leaders.
From 2012 to 2022, the most notable rate of growth in terms of shipments, amongst the key exporting countries, was attained by Thailand (with a CAGR of +28.3%), while the other global leaders experienced more modest paces of growth.
In value terms, Thailand ($393M) remains the largest coconut supplier worldwide, comprising 48% of global exports. The second position in the ranking was taken by Indonesia ($163M), with a 20% share of global exports. It was followed by Vietnam, with an 11% share.
From 2012 to 2022, the average annual rate of growth in terms of value in Thailand totaled +31.9%. In the other countries, the average annual rates were as follows: Indonesia (+16.8% per year) and Vietnam (+5.2% per year).
Export Prices By Country
In 2022, the average coconut export price amounted to $467 per ton, reducing by -3.7% against the previous year. Over the period under review, the export price, however, continues to indicate a relatively flat trend pattern. The growth pace was the most rapid in 2018 an increase of 24%. As a result, the export price reached the peak level of $566 per ton. From 2019 to 2022, the average export prices remained at a somewhat lower figure.
Prices varied noticeably by country of origin: amid the top suppliers, the country with the highest price was Thailand ($693 per ton), while Indonesia ($246 per ton) was amongst the lowest.
From 2012 to 2022, the most notable rate of growth in terms of prices was attained by Thailand (+2.8%), while the other global leaders experienced more modest paces of growth.
This report provides an in-depth analysis of the global coconut market. Within it, you will discover the latest data on market trends and opportunities by country, consumption, production and price developments, as well as the global trade (imports and exports). The forecast exhibits the market prospects through 2030.
Product coverage:
- FCL 249 - Coconuts
Country coverage:
Worldwide - the report contains statistical data for 200 countries and includes detailed profiles of the 50 largest consuming countries:
- USA
- China
- Japan
- Germany
- United Kingdom
- France
- Brazil
- Italy
- Russian Federation
- India
- Canada
- Australia
- Republic of Korea
- Spain
- Mexico
- Indonesia
- Netherlands
- Turkey
- Saudi Arabia
- Switzerland
- Sweden
- Nigeria
- Poland
- Belgium
- Argentina
- Norway
- Austria
- Thailand
- United Arab Emirates
- Colombia
- Denmark
- South Africa
- Malaysia
- Israel
- Singapore
- Egypt
- Philippines
- Finland
- Chile
- Ireland
- Pakistan
- Greece
- Portugal
- Kazakhstan
- Algeria
- Czech Republic
- Qatar
- Peru
- Romania
- Vietnam
+ the largest producing countries
Data coverage:
- Global market volume and value
- Per Capita consumption
- Forecast of the market dynamics in the medium term
- Global production, split by region and country
- Global trade (exports and imports)
- Export and import prices
- Market trends, drivers and restraints
- Key market players and their profiles
Company coverage:
Reasons to buy this report:
- Take advantage of the latest data
- Find deeper insights into current market developments
- Discover vital success factors affecting the market
This report is designed for manufacturers, distributors, importers, and wholesalers, as well as for investors, consultants and advisors.
In this report, you can find information that helps you to make informed decisions on the following issues:
- How to diversify your business and benefit from new market opportunities
- How to load your idle production capacity
- How to boost your sales on overseas markets
- How to increase your profit margins
- How to make your supply chain more sustainable
- How to reduce your production and supply chain costs
- How to outsource production to other countries
- How to prepare your business for global expansion
While doing this research, we combine the accumulated expertise of our analysts and the capabilities of artificial intelligence. The AI-based platform, developed by our data scientists, constitutes the key working tool for business analysts, empowering them to discover deep insights and ideas from the marketing data.
-
1. INTRODUCTION
Making Data-Driven Decisions to Grow Your Business
- REPORT DESCRIPTION
- RESEARCH METHODOLOGY AND AI PLATFORM
- DATA-DRIVEN DECISIONS FOR YOUR BUSINESS
- GLOSSARY AND SPECIFIC TERMS
-
2. EXECUTIVE SUMMARY
A Quick Overview of Market Performance
- KEY FINDINGS
- MARKET TRENDS This Chapter is Available Only for the Professional Edition PRO
-
3. MARKET OVERVIEW
Understanding the Current State of The Market and Its Prospects
- MARKET SIZE
- CONSUMPTION BY COUNTRY
- MARKET FORECAST TO 2030
-
4. MOST PROMISING PRODUCT
Finding New Products to Diversify Your Business
This Chapter is Available Only for the Professional Edition PRO- TOP PRODUCTS TO DIVERSIFY YOUR BUSINESS
- BEST-SELLING PRODUCTS
- MOST CONSUMED PRODUCT
- MOST TRADED PRODUCT
- MOST PROFITABLE PRODUCT FOR EXPORT
-
5. MOST PROMISING SUPPLYING COUNTRIES
Choosing the Best Countries to Establish Your Sustainable Supply Chain
This Chapter is Available Only for the Professional Edition PRO- TOP COUNTRIES TO SOURCE YOUR PRODUCT
- TOP PRODUCING COUNTRIES
- COUNTRIES WITH TOP YIELDS
- TOP EXPORTING COUNTRIES
- LOW-COST EXPORTING COUNTRIES
-
6. MOST PROMISING OVERSEAS MARKETS
Choosing the Best Countries to Boost Your Exports
This Chapter is Available Only for the Professional Edition PRO- TOP OVERSEAS MARKETS FOR EXPORTING YOUR PRODUCT
- TOP CONSUMING MARKETS
- UNSATURATED MARKETS
- TOP IMPORTING MARKETS
- MOST PROFITABLE MARKETS
7. GLOBAL PRODUCTION
The Latest Trends and Insights into The Industry
- PRODUCTION VOLUME AND VALUE
- PRODUCTION BY COUNTRY
- HARVESTED AREA AND YIELD BY COUNTRY
8. GLOBAL IMPORTS
The Largest Importers on The Market and How They Succeed
- IMPORTS FROM 2012–2023
- IMPORTS BY COUNTRY
- IMPORT PRICES BY COUNTRY
9. GLOBAL EXPORTS
The Largest Exporters on The Market and How They Succeed
- EXPORTS FROM 2012–2023
- EXPORTS BY COUNTRY
- EXPORT PRICES BY COUNTRY
-
10. PROFILES OF MAJOR PRODUCERS
The Largest Producers on The Market and Their Profiles
This Chapter is Available Only for the Professional Edition PRO -
11. COUNTRY PROFILES
The Largest Markets And Their Profiles
This Chapter is Available Only for the Professional Edition PRO- United States
- China
- Japan
- Germany
- United Kingdom
- France
- Brazil
- Italy
- Russian Federation
- India
- Canada
- Australia
- Republic of Korea
- Spain
- Mexico
- Indonesia
- Netherlands
- Turkey
- Saudi Arabia
- Switzerland
- Sweden
- Nigeria
- Poland
- Belgium
- Argentina
- Norway
- Austria
- Thailand
- United Arab Emirates
- Colombia
- Denmark
- South Africa
- Malaysia
- Israel
- Singapore
- Egypt
- Philippines
- Finland
- Chile
- Ireland
- Pakistan
- Greece
- Portugal
- Kazakhstan
- Algeria
- Czech Republic
- Qatar
- Peru
- Romania
- Vietnam
-
LIST OF TABLES
- Key Findings In 2023
- Market Volume, In Physical Terms, 2012–2023
- Market Value, 2012–2023
- Per Capita Consumption, By Country, 2018–2023
- Production, In Physical Terms, By Country, 2012–2023
- Harvested Area, By Country, 2012-2023
- Yield, By Country, 2012-2023
- Imports, In Physical Terms, By Country, 2012–2023
- Imports, In Value Terms, By Country, 2012–2023
- Import Prices, By Country Of Destination, 2012–2023
- Exports, In Physical Terms, By Country, 2012–2023
- Exports, In Value Terms, By Country, 2012–2023
- Export Prices, By Country Of Origin, 2012–2023
-
LIST OF FIGURES
- Market Volume, In Physical Terms, 2012–2023
- Market Value, 2012–2023
- Consumption, By Country, 2023
- Market Volume Forecast to 2030
- Market Value Forecast to 2030
- Products: Market Size And Growth, By Type
- Products: Average Per Capita Consumption, By Type
- Products: Exports And Growth, By Type
- Products: Export Prices And Growth, By Type
- Production Volume And Growth
- Yield And Growth
- Exports And Growth
- Export Prices And Growth
- Market Size And Growth
- Per Capita Consumption
- Imports And Growth
- Import Prices
- Production, In Physical Terms, 2012–2023
- Production, In Value Terms, 2012–2023
- Area Harvested, 2012–2023
- Yield, 2012–2023
- Production, By Country, 2023
- Production, In Physical Terms, By Country, 2012–2023
- Harvested Area, By Country, 2023
- Harvested Area, By Country, 2012-2023
- Yield, By Country, 2012-2023
- Imports, In Physical Terms, 2012–2023
- Imports, In Value Terms, 2012–2023
- Imports, In Physical Terms, By Country, 2023
- Imports, In Physical Terms, By Country, 2012–2023
- Imports, In Value Terms, By Country, 2012–2023
- Import Prices, By Country, 2012–2023
- Exports, In Physical Terms, 2012–2023
- Exports, In Value Terms, 2012–2023
- Exports, In Physical Terms, By Country, 2023
- Exports, In Physical Terms, By Country, 2012–2023
- Exports, In Value Terms, By Country, 2012–2023
- Export Prices, 2012–2023
This report provides an in-depth analysis of the global coconut market.
This report provides an in-depth analysis of the global brazil nut market.
This report provides an in-depth analysis of the global cashew nut market.
This report provides an in-depth analysis of the global oil crops market.
In 2019, after two years of growth, there was decline in the global coconut market, when its value decreased by -3.2%...
Global brazil nut consumption amounted to X thousand tons in 2015, increasing by +X% against the previous year level.
In 2015, the countries with the highest levels of production in 2015 were Bolivia (X thousand tons), Brazil (X thousand tons), Côte D'Ivoire (X thousand tons), together accounting for X% of total output.
Modern processes of globalization and improvement of production and logistics processes stimulate the development of exotic product markets. For example, if earlier Brazil nuts were strictly a local commodity, now they are
Bolivia dominates in the global Brazil nut trade. In 2014, Bolivia exported X thousand tons of Brazil nuts totaling X million USD, a robust X% over the previous year. Its primary trading partner was the United Kingdom, where it supplied X% of it
The global cashew nut market expanded significantly to $14.9B in 2019, growing by 5.6% against the previous year....
Global cashew nut consumption amounted to X thousand tons in 2015, remaining constant against the previous year level.
In 2015, the countries with the highest levels of production in 2015 were Nigeria (X thousand tons), India (X thousand tons), Vietnam (X thousand tons), together accounting for X% of total output.
India dominates in the global cashew nut trade. In 2014, India exported X thousand tons of cashew nuts totaling X million USD, X% under the previous year. Its primary trading partner was the U.S., where it supplied X% of its total cashew nut exp
The output of the four major producers of cashew nuts, namely Vietnam, Nigeria, India and Côte d'Ivoire, constitute more than X% of global output.


